the Creative Commons Attribution 4.0 License.
the Creative Commons Attribution 4.0 License.
 | 24 Jan 2019
A wireless monitoring system for a high-power borehole–ground electromagnetic transmitter
Shuangshuang Cheng
Ming Deng
Meng Wang
Sheng Jin
Qisheng Zhang
Kai Chen
Visual interfaces and wireless monitoring have played significant roles in the application of electromagnetic transmitters. Therefore, we have designed a wireless monitoring system that is based on the Visual Studio 2015 Windows form application by using C# language and multi-threading technology. The system can effectively implement many functions, including time monitoring via a real-time clock, switching of the transmitting frequency, changing of transmission mode, and the storage and verification of the transmitter condition information. These things allow the wireless monitoring system to support condition monitoring and operation control of the transmitter. The results of several field tests confirm that the proposed wireless monitoring system provides a user-friendly interface and convenient and stable operation. The system is able to satisfy the wireless monitoring and multifunctional demands for transmitters implemented in land electromagnetic exploration and act as a reference for scientific researchers pursuing instrument development and electromagnetic prospecting.


Electromagnetic (EM) methods have been extensively developed and applied (Deng et al., 2003; Zhang et al., 2004; Jin et al., 2010; Geng, 2016). Artificial source EM methods are essential to metal deposits, column collapse, and groundwater exploration. Moreover, there has been an increasing trend of deep exploration (Daniels and Dyck, 1984; Wei, 2002), which requires implementation of EM instruments to be able to achieve high resolution, large detection depth, and high reliability (Chen et al., 2018). In addition, because the performance of the transmitter is of particular importance for EM exploration, research institutes, instrument manufacturers, and academia have been working to enhance the transmitting power of EM transmitters.
China University of Geosciences (Beijing) developed a high-power, multifunctional borehole–ground EM transmitter. This transmitter is used to transmit stable current waveforms for artificial source EM exploration (Liu et al., 2011; Wang et al., 2011a). However, the prospecting process requires researchers to be able to freely change the frequency of the transmission waveform. In addition, it is essential to monitor the conditions of the transmitter during EM exploration (Chen et al., 2016; Wang et al., 2017). Therefore, in order to satisfy the requirement of the transmitter designed and developed by China University of Geosciences (Beijing), a wireless monitoring system with a simple operation and user-friendly interface had been developed.
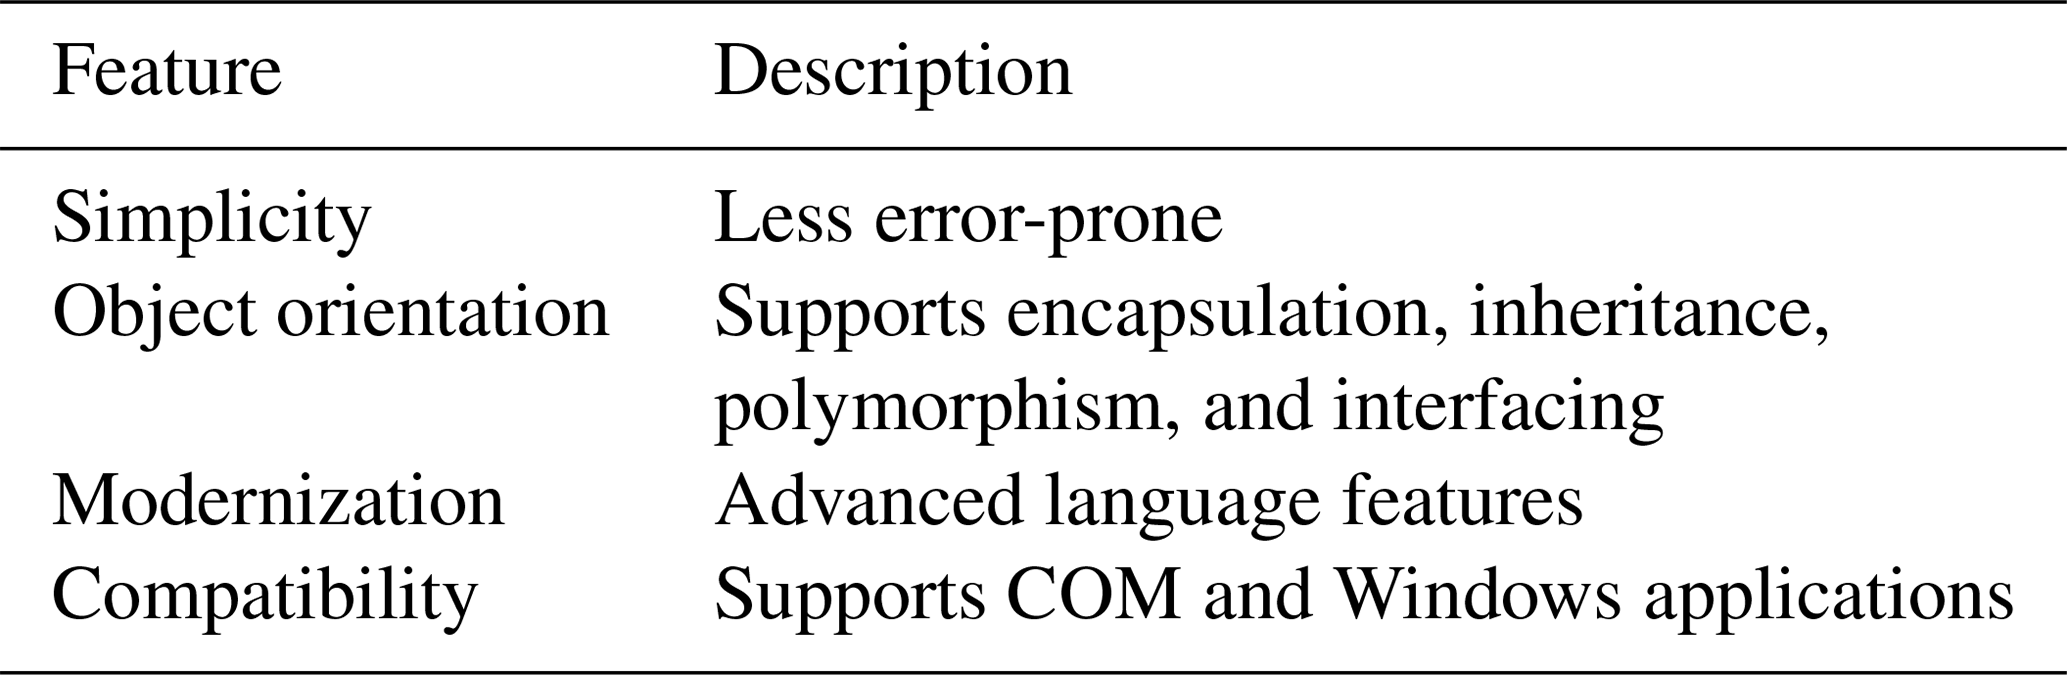
The system is designed as based on the Visual Studio 2015 Windows form application program by using the C# programming language. C#, which is based on .Net, is an object-oriented new programming language derived from C and Java programming languages. It can be applied to relatively easily develop interface applications, thereby shortening the development cycle. The features of C# are shown in Table 1.
The functional block diagram of the wireless monitoring system is divided into four parts, as is shown in Fig. 1, and a screenshot of the basic interface is shown in Fig. 2.
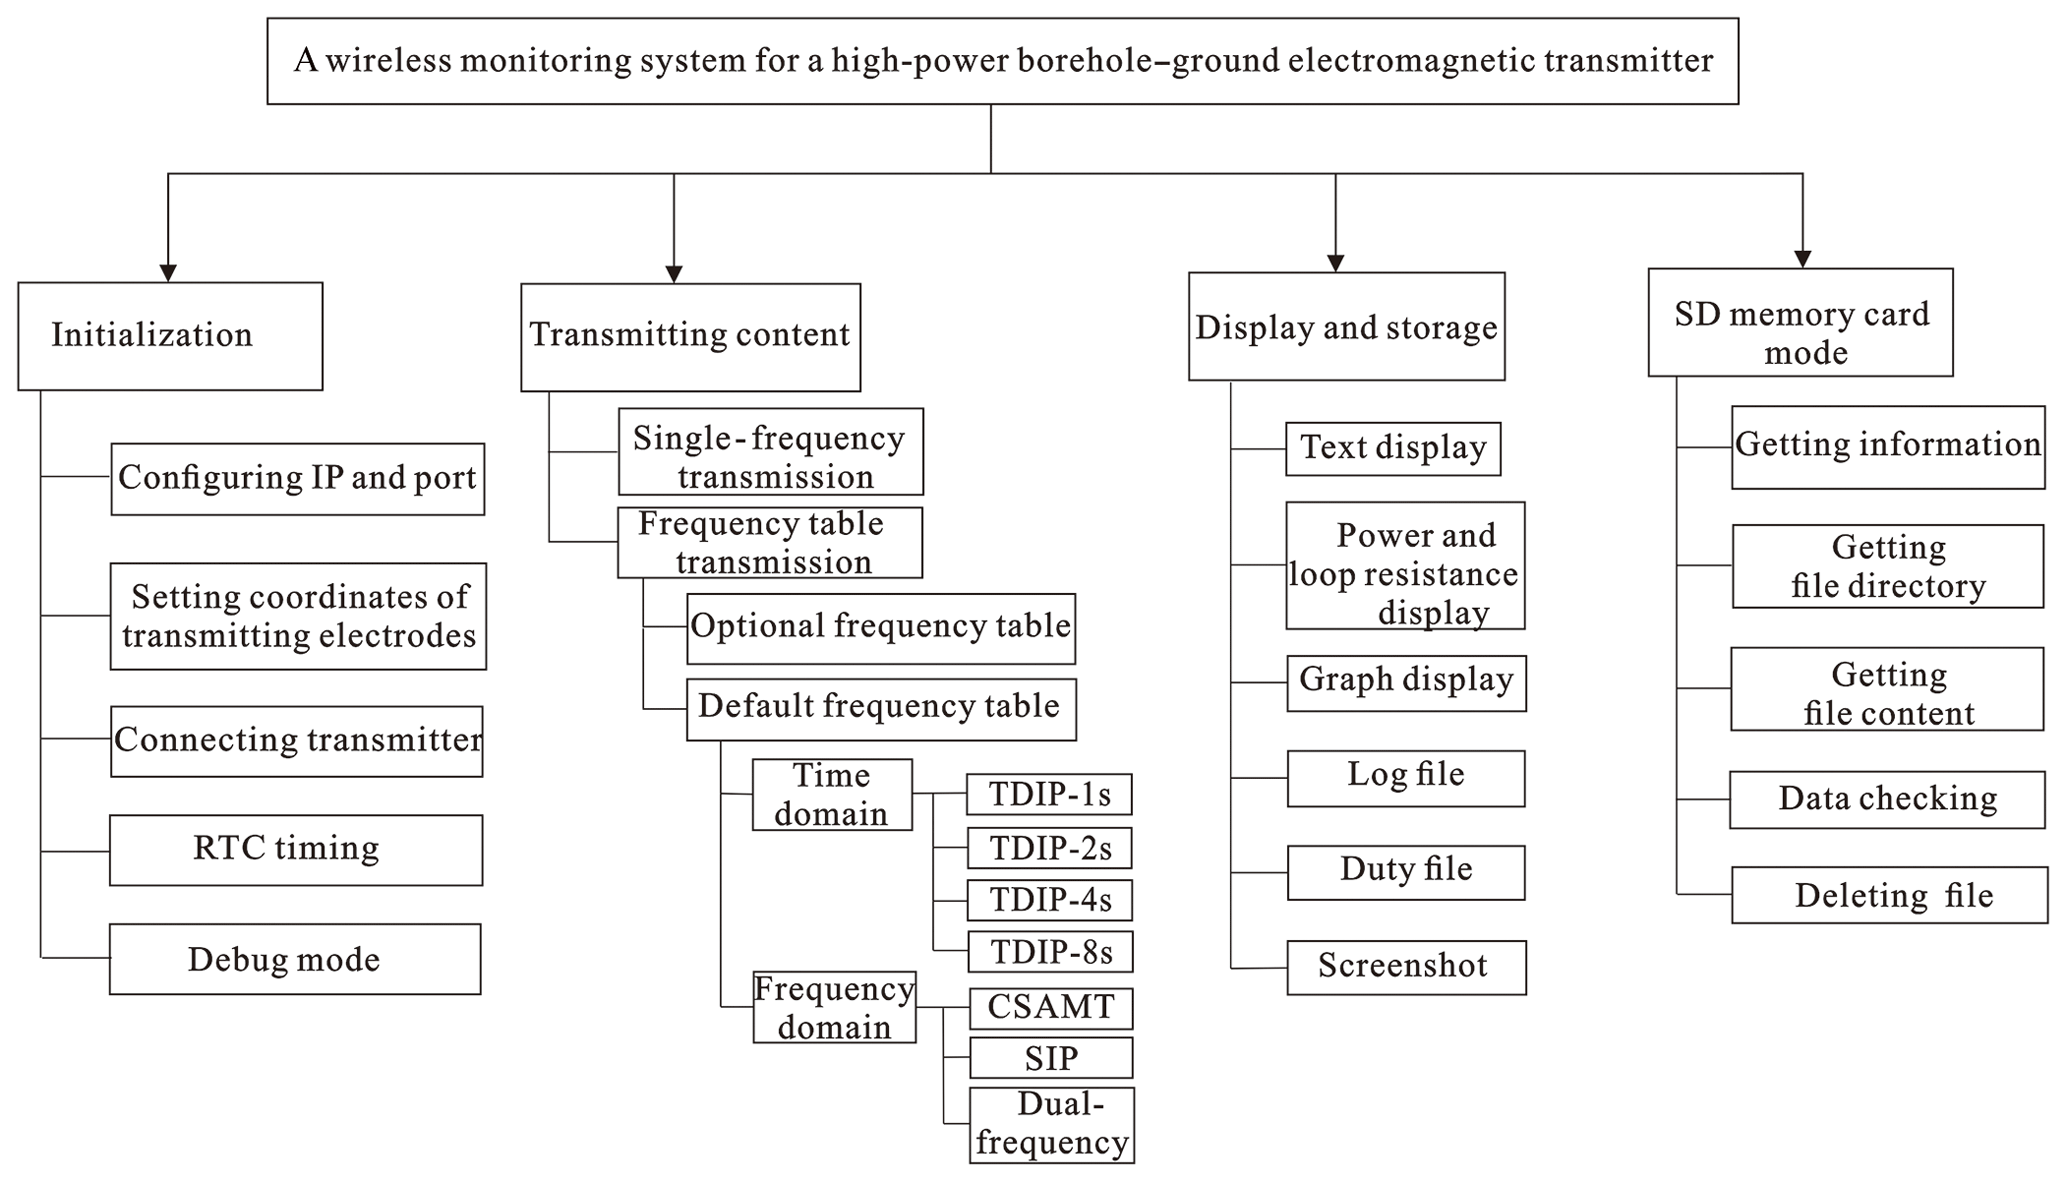
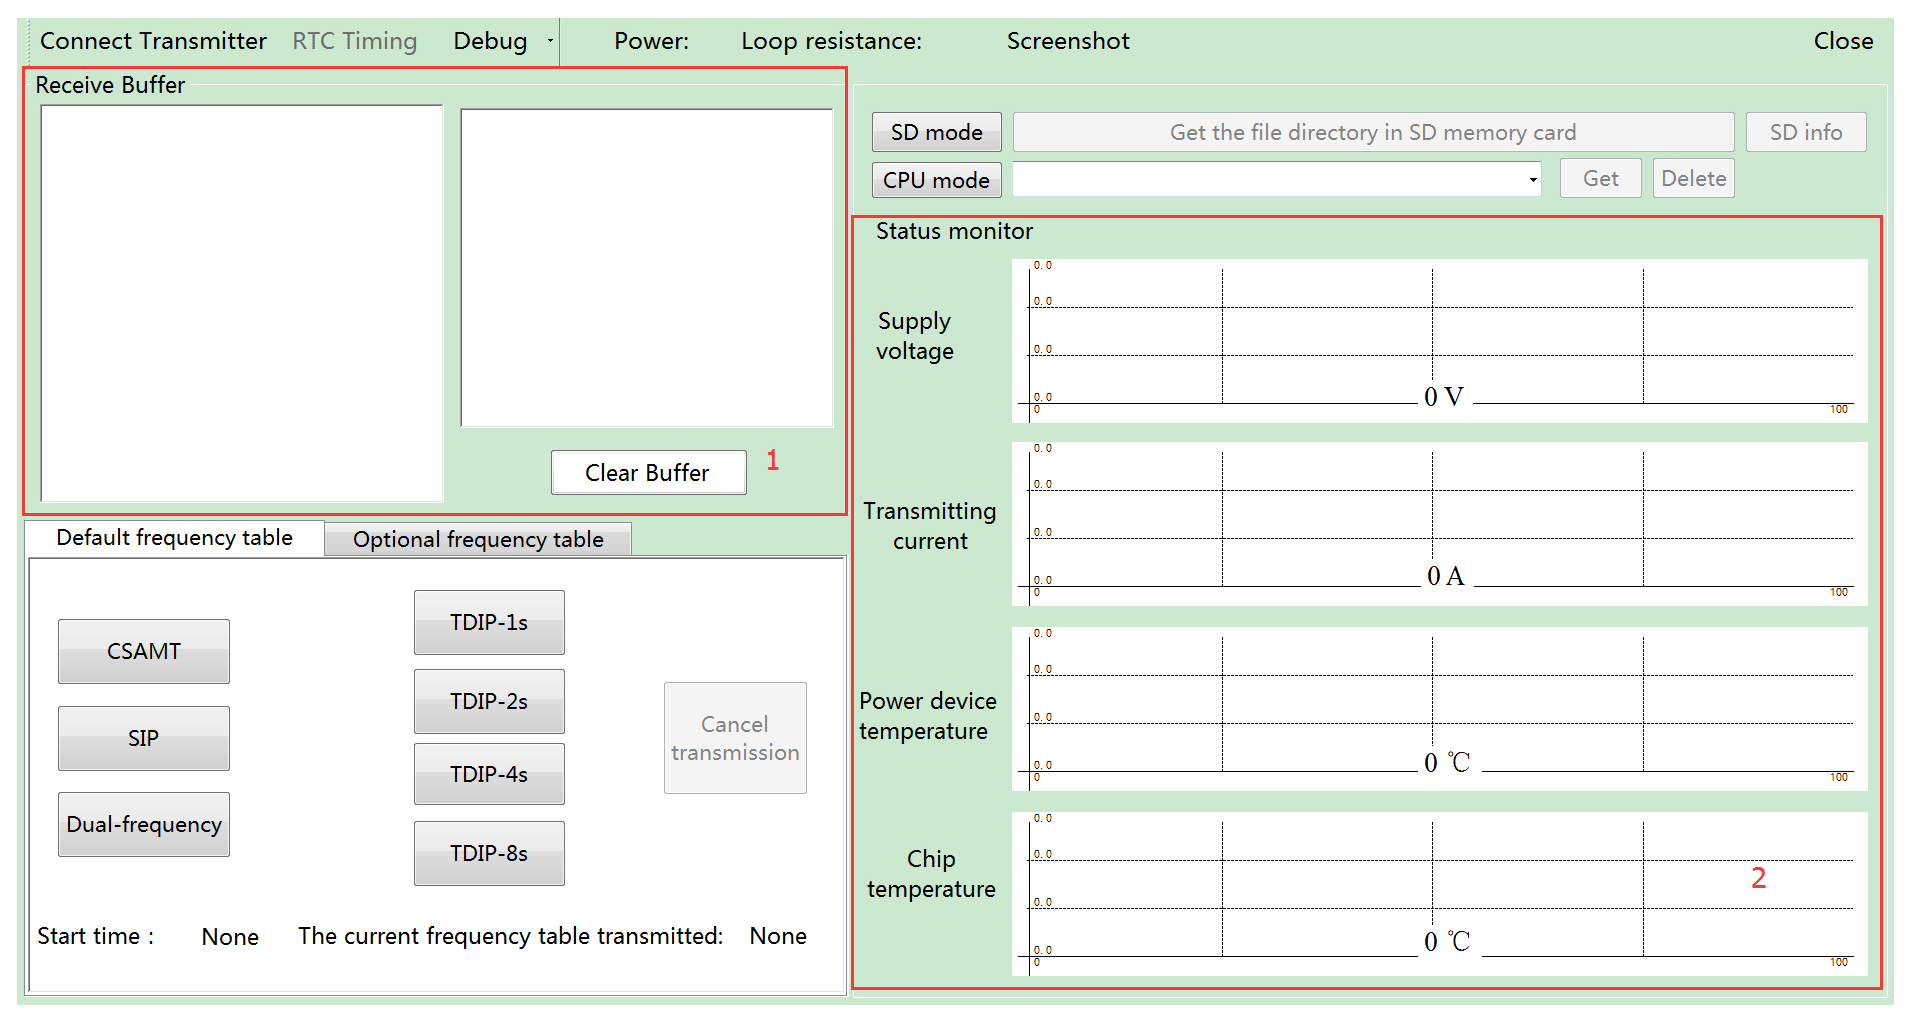
Figure 2Wireless monitoring system interface.
3.1 Initialization
As the system is designed for wireless communication, Wi-Fi IP address and port number are first configured; then, the Global Positioning System (GPS) coordinates of the transmitting electrodes are set. In the design, these configurations are implemented by utilizing the Windows form application in Visual Studio 2015. Subsequently, the system is connected to, and communicates with, the transmitter via socket programming. After securing the connection, debug mode is performed to ensure the proper functioning of the transmitter; then, real-time clock (RTC) timing is initiated (Wang et al., 2011b).
RTC timing refers to the ability of the clock to check its time against that of the GPS to ensure that they are in agreement; furthermore, if there is a discrepancy, it will be corrected. It should be noted that the precision of the clock in the instrument relative to the GPS clock is on the order of microseconds; this scale satisfies the requirements of the instrument in terms of time accuracy (Zhang et al., 2004). In this design, a GPS-controlled pulse-per-second (PPS) signal is used as the synchronization reference signal to confirm clock agreement and initiate synchronization (Coïsson et al., 2017). Moreover, because the rising edge of a PPS signal in GPS corresponds to a precise Coordinated Universal Time (UTC), the hardware is able to realize and maintain precise GPS timing.
3.2 Transmitting content
3.2.1 Single-frequency transmission
The “single frequency” tab is located in the drop-down menu of debug mode, which is primarily used in the test preparation phase. The single-frequency list is shown in Fig. 3 and ranges from 0.01 Hz to 10 kHz. Note that the transmitter is not only able to transmit the listed frequency but also the frequency entered in the text box shown in Fig. 3.

Figure 3Single-frequency list.
3.2.2 Frequency table transmission
Frequency table control implementation is divided between the default frequency table and the “optional frequency table” tabs, as is shown in Fig. 4.
The “default frequency table” tab includes the frequency and time domains. The frequency domains include controlled-source audio-frequency magnetotellurics (CSAMT) (Sandberg and Hohmann, 1982), spectrum-induced polarization (SIP) (Johnson, 1984), and dual-frequency (100 and 400 Hz) implementation. The time domains support time-domain-induced polarization (TDIP) (Marshall and Madden, 1959), which includes TDIP-1s, TDIP-2s, TDIP-4s, and TDIP-8s. The currently desired waveform can be easily transmitted by clicking on one of the functions shown in the “default frequency table” tab shown on the left in Fig. 4.
Additionally, a function to prevent spurious triggering of the waveform is included that is necessary to ensure stable operation of the transmitter. When a function button in the “default frequency table” tab is selected, the only other function button enabled is the “cancel transmission” function button shown on standby in Fig. 4. Therefore, when a function button in the default frequency table is selected, the user is able to cancel cycle transmission as desired but cannot operate other functional buttons; this thereby acts as additional means to prevent spurious triggering.
The “optional frequency table” tab is shown on the right in Fig. 4. As can be seen, the users can select the appropriate frequency table and set the transmitting mode and suitable time. Therefore, it can be concluded that the proposed system offers flexibility to users.
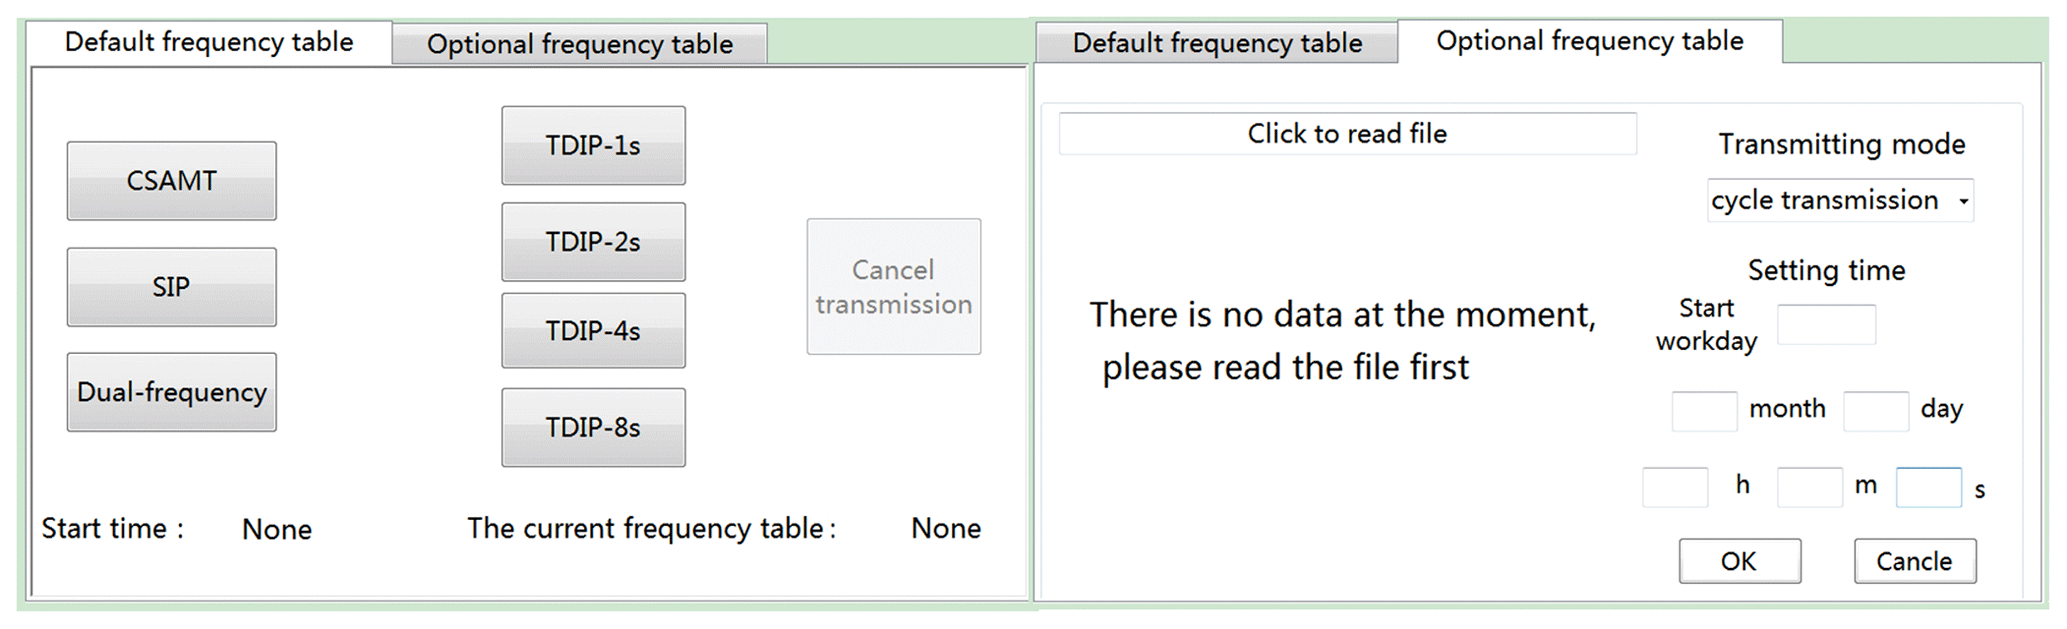
Figure 4Frequency table interface.
3.2.3 Display and storage
The system is designed with the ability to display data in real time, as is illustrated via the displayed functions highlighted in red boxes (denoted “1” and “2”) in Fig. 2. Box 1 highlights the receiving buffer function, which presents the data received via the wireless communication in the form of text. The receiving buffer displays the time and frequency information in the left-hand white field and the transmitter condition information in the right-hand white field; this information includes the corresponding values for power supply voltage, transmitting current, power device temperature, space temperature, chip temperature, and transmitting power. Box 2 displays the graphs for power supply voltage, transmitting current, power device temperature, and chip temperature. The purpose of these graphs is to allow the users to monitor the mentioned output information such that they can judge whether there are problems with transmitter operation.
The proposed system also incorporates a data storage function. Two files, which are referred to as the duty file and log file, are initiated in the background of the system after a successful connection between the system and transmitter is established. The two files record important information in real time in order to provide data for subsequent data processing. The function avoids the trouble and error of human recording and provides convenience for researchers. The part of the duty file and the screenshot of the log file are shown in Table 2 and Fig. 5, respectively.
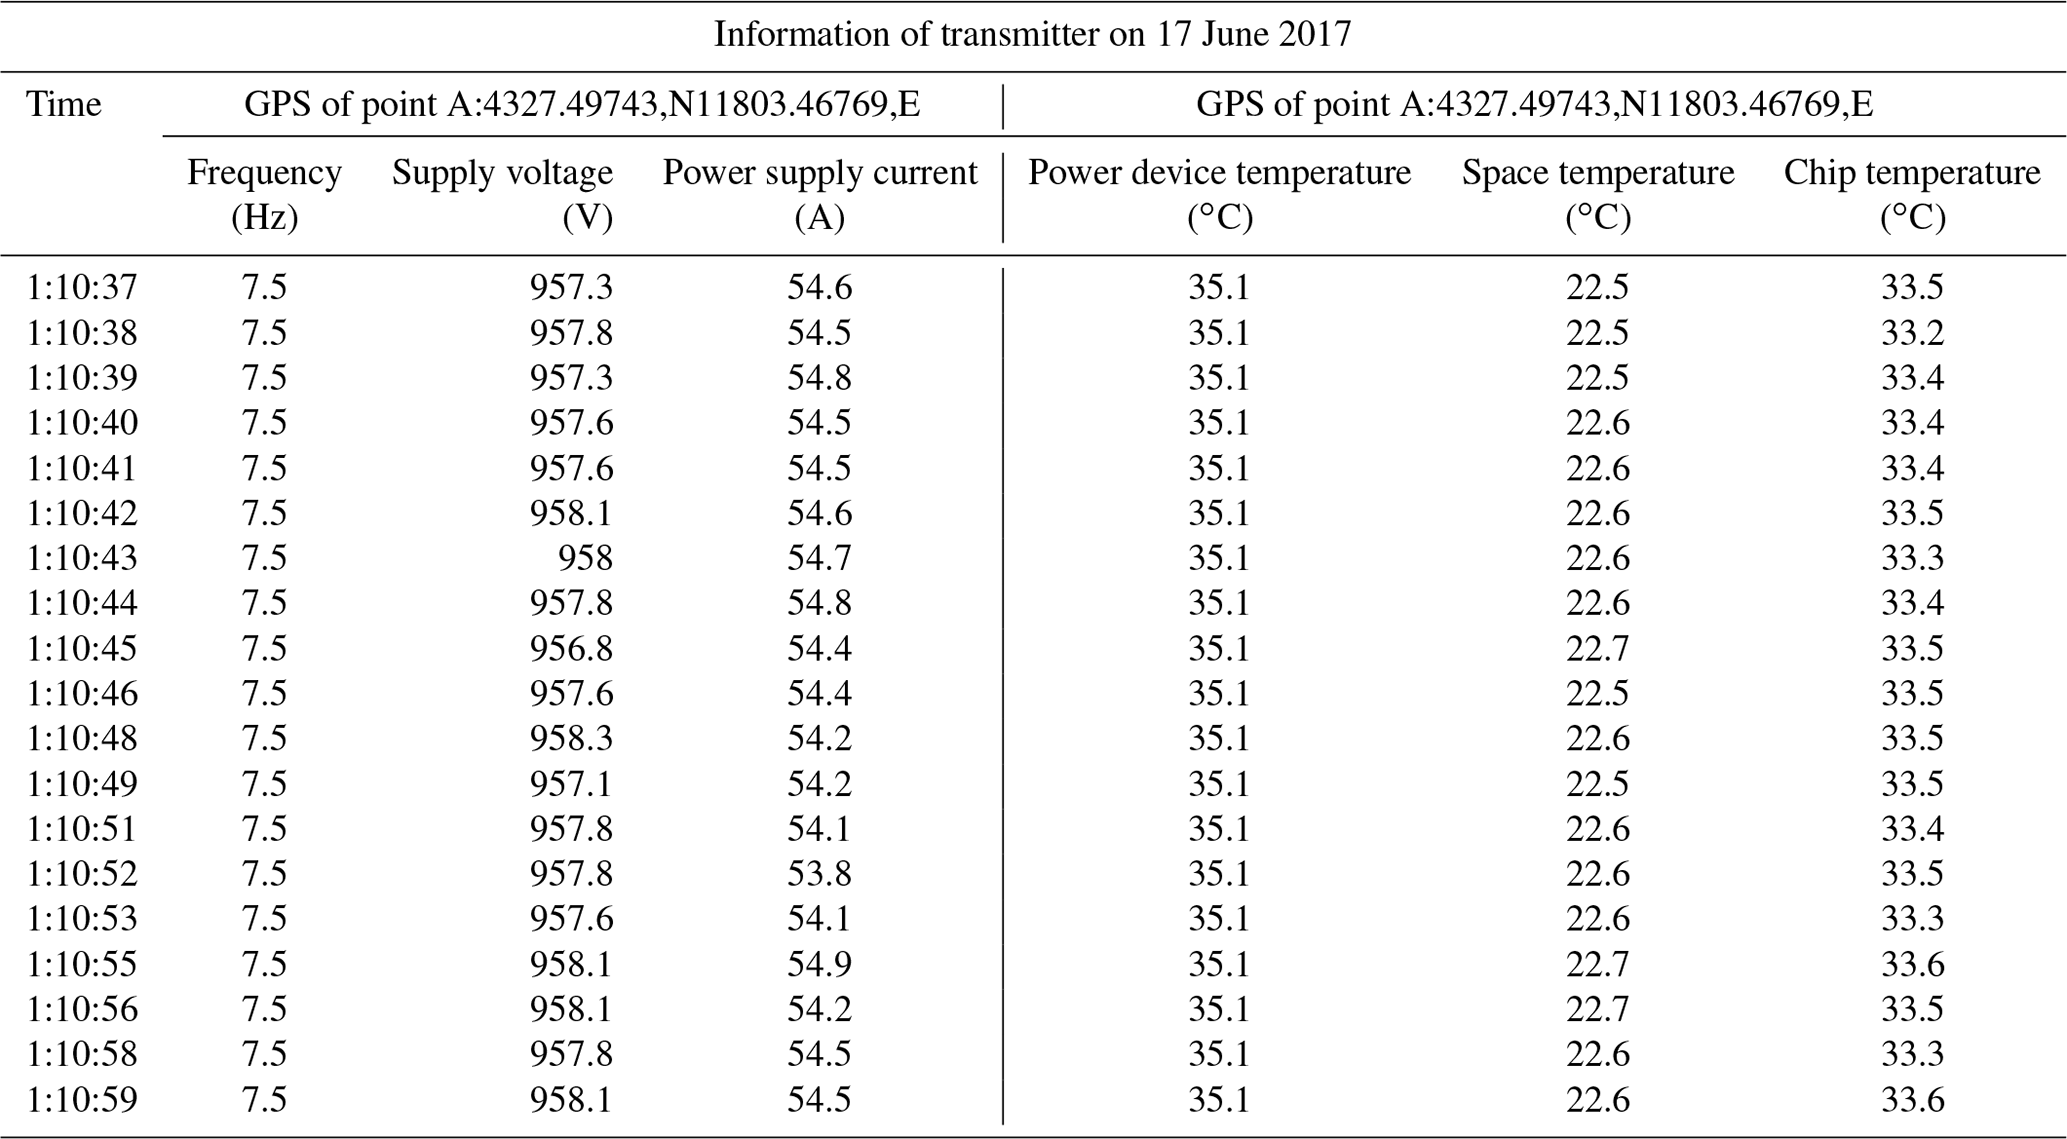
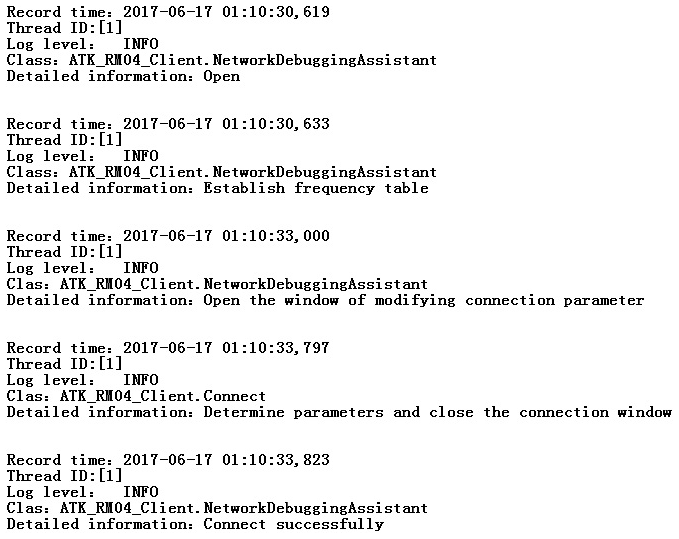
Figure 5Screenshot of the log file.
3.3 SD memory card mode
The proposed system is also equipped with an SD memory card mode. As a part of the hardware, the SD memory card performs real-time storage of transmitter condition information in a text file. The file stored in the SD memory card must be copied to the computer via wireless technology after completing the transmission. Because the data storage is updated every second and the total operating time is typically several hours, the text file is relatively large. Therefore, in order to avoid problems associated with data loss or format disorder in wireless transmission, a data check function is incorporated into the system. Each row of the storage data has row number and fixed format and length. For example, the output string is like this, N1_20170528090438#1.250000Hz$D:925.8,25.9,26.7,22.6, 34.4,E, Where N1 is the row number, 20170528090438 is the date time, 1.250000Hz is the frequency, 925.8, 25.9, 26.7, 22.6, and 34.4 are the transmitter condition information and the other elements are the identifiers. In the transmission process, the system judges whether the format and length of each row data are right or not. If the format or length is incorrect, the system will send retransmission instructions to the transmitter, and the transmitter will subsequently transmit the corresponding correct data; thereby, the accuracy of the wireless transmission will be improved.
In order to verify the stability and reliability of the proposed wireless monitoring system, several indoor and field tests were carried out. In June 2017, a field experiment was conducted in the Inner Mongolia Autonomous Region in China by using the artificial source transmitter developed by China University of Geosciences (Beijing).
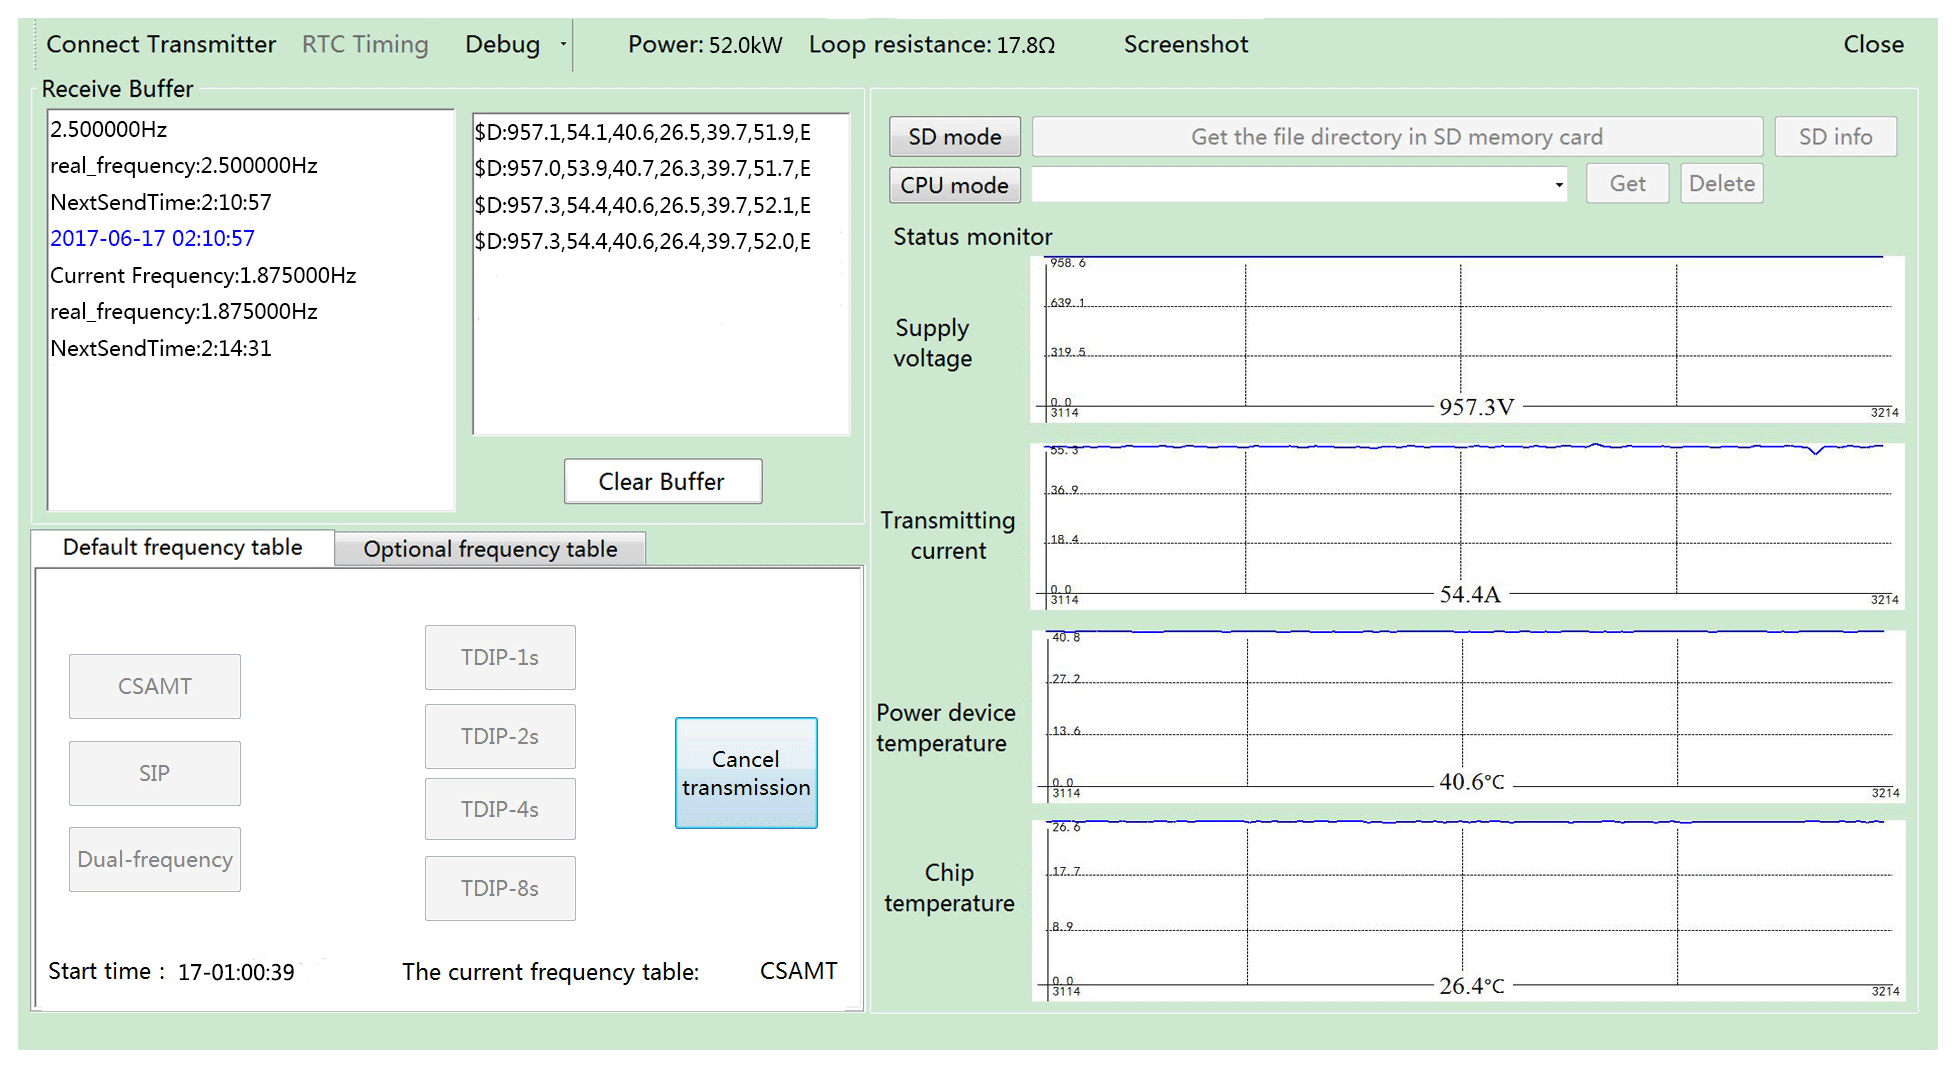
Figure 6Screenshot of monitoring system interface in field experiment.
4.1 System interface for field testing
A screenshot of the system interface implemented in the field testing is presented as Fig. 6. It can be seen that the current frequency table transmitted was CSAMT, the current frequency was 1.875 Hz, the power was 52.0 kW, and the loop resistance was 17.8Ω. The receiving buffer received the relevant frequency, time, and transmitter condition information. The condition monitoring field presented the graphs in real time as based on the data received from the transmitter via wireless technology. The continuity of these graphs further confirms the effectiveness of the wireless transmission function.
4.2 Data processing
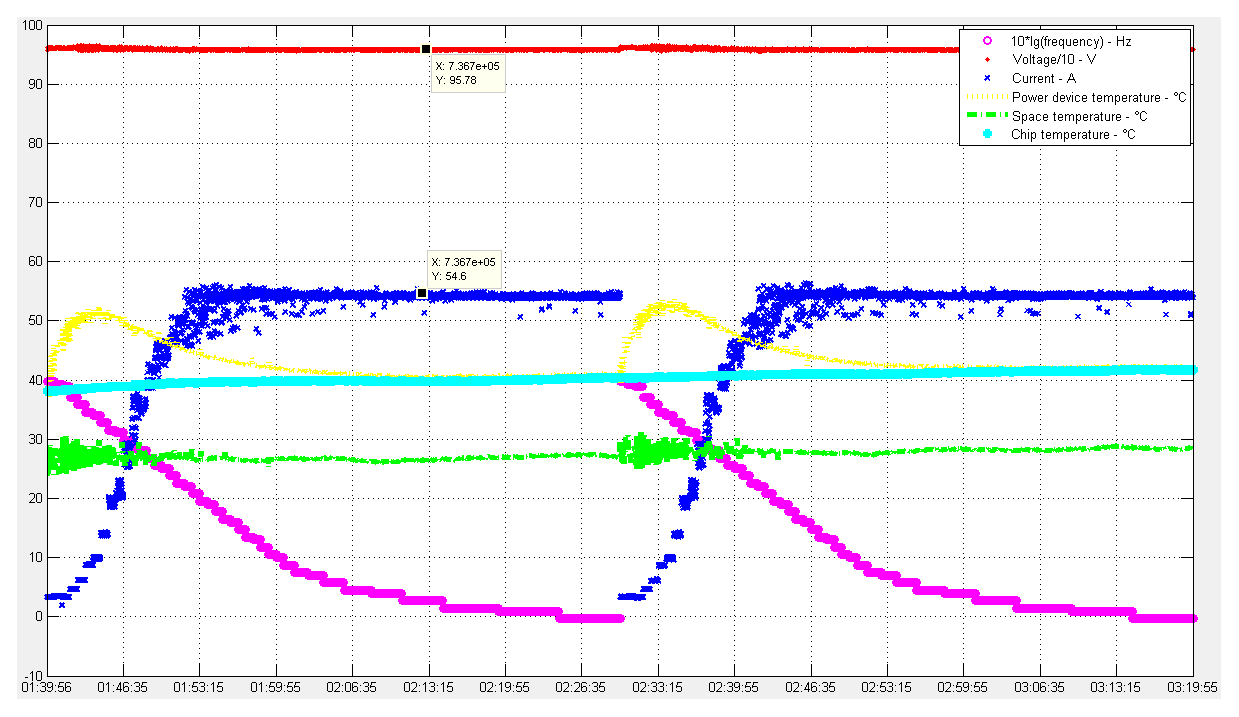
The data replay graph of transmitter condition information which was derived as based on the data of the duty file is shown in Fig. 7. The graphs were plotted by a data playback applet, which is designed based on MATLAB. The horizontal and vertical axes represent time and amplitude, respectively. It can be seen that the transmitter was in use for approximately 1 h and 40 min, the maximum transmitting voltage was 957.8 V, the maximum transmitting current was 54.6 A, and the transmitting power was calculated as approximately 52.3 kW. Additionally, the continuity of the plotted data indicates that the recorded data are relatively comprehensive, and it therefore demonstrates the reliability of the wireless transmission of the system for a high-power borehole–ground transmitter.
In this paper, a wireless monitoring system designed for high-power borehole–ground EM transmitters is presented to meet the demands for transmitters used in land EM exploration.
The results of several indoor and outdoor field tests indicate that the system is stable, easy to operate, and effectively monitors the operating conditions of an EM transmitter. The system offers two advantages, the first of which is high security. The system is able to perform the function of real-time monitoring of the EM transmitter via wireless technology and eliminates the risk of the tester possibly being exposed to the transmitter during the test processing. The second advantage is simple operation. The system simplifies a series of configuration operations and enables transmitter control via clicking on a function button in the system interface. However, there exist a distance problem and a universality problem. The wireless monitoring system and the transmitter cannot be too far away due to the limitation of the wireless transmission mode. The distance is up to 50 m in the field. And the system is designed for self-developed EM transmitters and cannot be used in other EM transmitters. The primary reason is that we cannot know the communication protocol of the other transmitters. In a word, the system provides convenience and provides a reference for researchers engaged in instrument development and EM exploration.
There are no publicly available data for this study.
SC researched and developed the system and wrote the article; MD played a guiding role; MW and SJ provided the experimental data; QZ and KC provided the experimental equipment.
The authors declare that they have no conflict of interest.
General funding was provided by the National High Technology Research and
Development Program of China (2014AA06A603).
Edited by: Luis Vazquez
Reviewed by: three anonymous referees
Chen, G. Y., Deng, M., Jin, S., Wang, M., Wu, C. X., and Zong, F. Y.: Design of embeded human-machine interaction system of borehole-to-surface electromagnetic transmitter, Progress in Geophysics, 31, 2319–2325, https://doi.org/10.6038/pg20160560, 2016 (in Chinese).
Chen, K., Jin, S., and Deng, M.: Multifunction waveform generator for EM receiver testing, Geosci. Instrum. Method. Data Syst., 7, 11–19, https://doi.org/10.5194/gi-7-11-2018, 2018.
Coïsson, P., Telali, K., Heumez, B., Lesur, V., Lalanne, X., and Xin, C. J.: Time-stamp correction of magnetic observatory data acquired during unavailability of time-synchronization services, Geosci. Instrum. Method. Data Syst., 6, 311–317, https://doi.org/10.5194/gi-6-311-2017, 2017.
Daniels, J. J. and Dyck, A. V.: Borehole resistivity and electromagnetic methods applied to mineral exploration, IEEE Geosci. Remote, 22, 80–87, 1984.
Deng, M., Li, Z., Wei, W. B., Tan, H. D., Jin, S., and Deng, J. W.: Seafloor magnetotelluric synchronous acquisition technology with far reference measurement method, Geology and Prospecting, 39, 77–80, 2003.
Geng, Q. L.: The latest multifunctional electromagnetic instrument and its development trend at home and abroad, Equipment for Geotechnical Engineering, 17, 26–29, 2016.
Jin, S., Zhang, L. T., and Wei, W. B.: Magnetotelluric method for deep detection of Chinese continent, Acta Geologica Sinica, 84, 808–817, 2010.
Johnson, I. M.: Spectral induced polarization parameters as determined through time-domain measurements, Geophysics, 49, 1993–2003, 1984.
Liu, L. X., Liang, Z. S., Liang, H. Q., Yin, H. D., and Liu, Y.: A study on current stabilization technology of transmitter for controlled-source frequency electromagnetic sounding, in: the Tenth International Conference on Electronic Measurement & Instruments (ICEMI), Chengdu, China, 16–19 August 2011, 357–360, 2011.
Marshall, D. J. and Madden, T. R.: Induced polarization, a study of its causes, Geophysics, 24, 790–816, 1959.
Sandberg, S. K. and Hohmann, G. W.: Controlled-source audiomagnetotellurics in geothermal exploration, Geophysics, 47, 100–116, 1982.
Wang, M., Deng, M., Jin, S., and Wu, K.: High-power Pit(Well)-Ground electromagnetic automatic sweep frequency transmitter used for exploration of metal mine, in: 2011 Third International Conference on Measuring Technology and Mechatronics Automation, Shanghai, China, 6–7 January 2011, 332–335, 2011a.
Wang, M., Deng, M., Jin, S., and Wu, K.: The borehole-ground controlled source electromagnetic signal transmitter, in: 2011 International Conference on Electric Information and Control Engineering, Wuhan, China, 15–17 April 2011, 1782–1785, 2011b.
Wang, M., Jin, S., Deng, M. Wei, W. B., and Chen, K.: Multi-function electromagnetic transmitting system for mineral exploration, IEEE T. Power Electr., 33, 8288–8297, 2017.
Wei, W. B.: New advance and prospect of magnetotelluric sounding (MT) in China, Progress in Geophysics, 17, 245–254, https://doi.org/10.3969/j.issn.1004-2903.2002.02.009, 2002 (in Chinese).
Zhang, Q. S., Deng, M., Luo, F., Qiao, D. X., and Chen, K.: Circuit drivers of signal-acquiring unit in seafloor magnetotelluric system, Progress in Geophysics, 31, 1845–1851, https://doi.org/10.3969/j.issn.1004-2903.2004.04.015, 2004 (in Chinese).