the Creative Commons Attribution 4.0 License.
the Creative Commons Attribution 4.0 License.
 | 13 Feb 2019
Description of the Baseline Surface Radiation Network (BSRN) station at the Izaña Observatory (2009–2017): measurements and quality control/assurance procedures
Rosa Delia García
Ramón Ramos
Victoria Eugenia Cachorro
Alberto Redondas
José A. Moreno-Ruiz
The Baseline Surface Radiation Network (BSRN) was implemented by the World Climate Research Programme (WCRP) starting observations with nine stations in 1992, under the auspices of the World Meteorological Organization (WMO). Currently, 59 BSRN stations submit their data to the WCRP. One of these stations is the Izaña station (station IZA, no. 61) that enrolled in this network in 2009. This is a high-mountain station located in Tenerife (Canary Islands, Spain, at 28.3∘ N, 16.5∘ W; 2373 m a.s.l.) and is a representative site of the subtropical North Atlantic free troposphere. It contributes with basic-BSRN radiation measurements, such as global shortwave radiation (SWD), direct radiation (DIR), diffuse radiation (DIF) and longwave downward radiation (LWD), and extended-BSRN measurements, including ultraviolet ranges (UV-A and UV-B), shortwave upward radiation (SWU) and longwave upward radiation (LWU), and other ancillary measurements, such as vertical profiles of temperature, humidity and wind obtained from radiosonde profiles (WMO station no. 60018) and total column ozone from the Brewer spectrophotometer. The IZA measurements present high-quality standards since more than 98 % of the data are within the limits recommended by the BSRN. There is an excellent agreement in the comparison between SWD, DIR and DIF (instantaneous and daily) measurements with simulations obtained with the LibRadtran radiative transfer model. The root mean square error (RMSE) for SWD is 2.28 % for instantaneous values and 1.58 % for daily values, while the RMSE for DIR is 2.00 % for instantaneous values and 2.07 % for daily values. IZA is a unique station that provides very accurate solar radiation data in very contrasting scenarios: most of the time under pristine sky conditions and periodically under the effects of the Saharan air layer characterized by a high content of mineral dust. A detailed description of the BSRN program at IZA, including quality control and quality assurance activities, is given in this work.


The World Meteorological Organization (WMO) through its Global Change Observing System (GCOS) defined several essential climate variables (ECVs) as physical, chemical or biological variables or a group of linked variables that critically contributes to the characterization of Earth's climate. The ECVs have been selected with the aim to obtain enough evidence that effectively led us to predict the climate evolution and its possible associated risks.
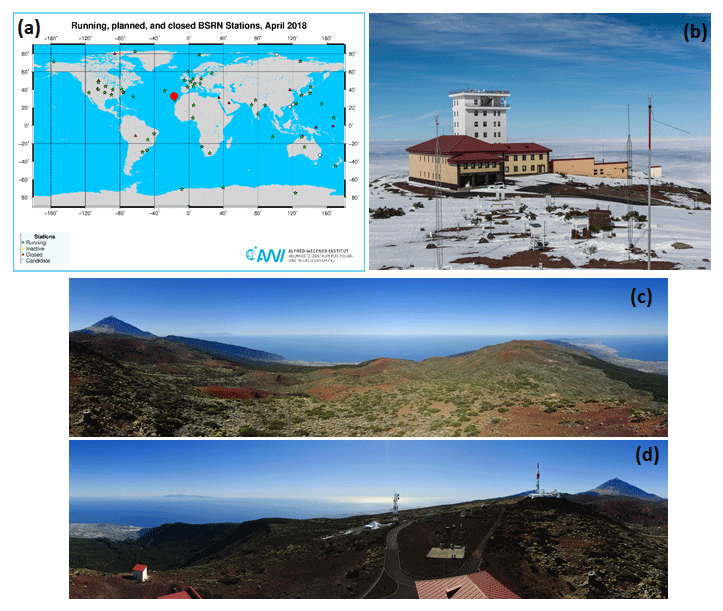
Figure 1(a) Location of the Izaña station (IZA) on a global map of all BSRN stations (http://bsrn.awi.de, last access: 7 February 2019). (b) Izaña Atmospheric Observatory. Views of Izaña radiation station: (c) northern and eastern views (azimuth 360∘, inclination 0∘; azimuth 90∘, inclination 0∘, respectively); (d) southern and western views (azimuth 180∘, inclination 0∘; azimuth 270∘, inclination 0∘, respectively).
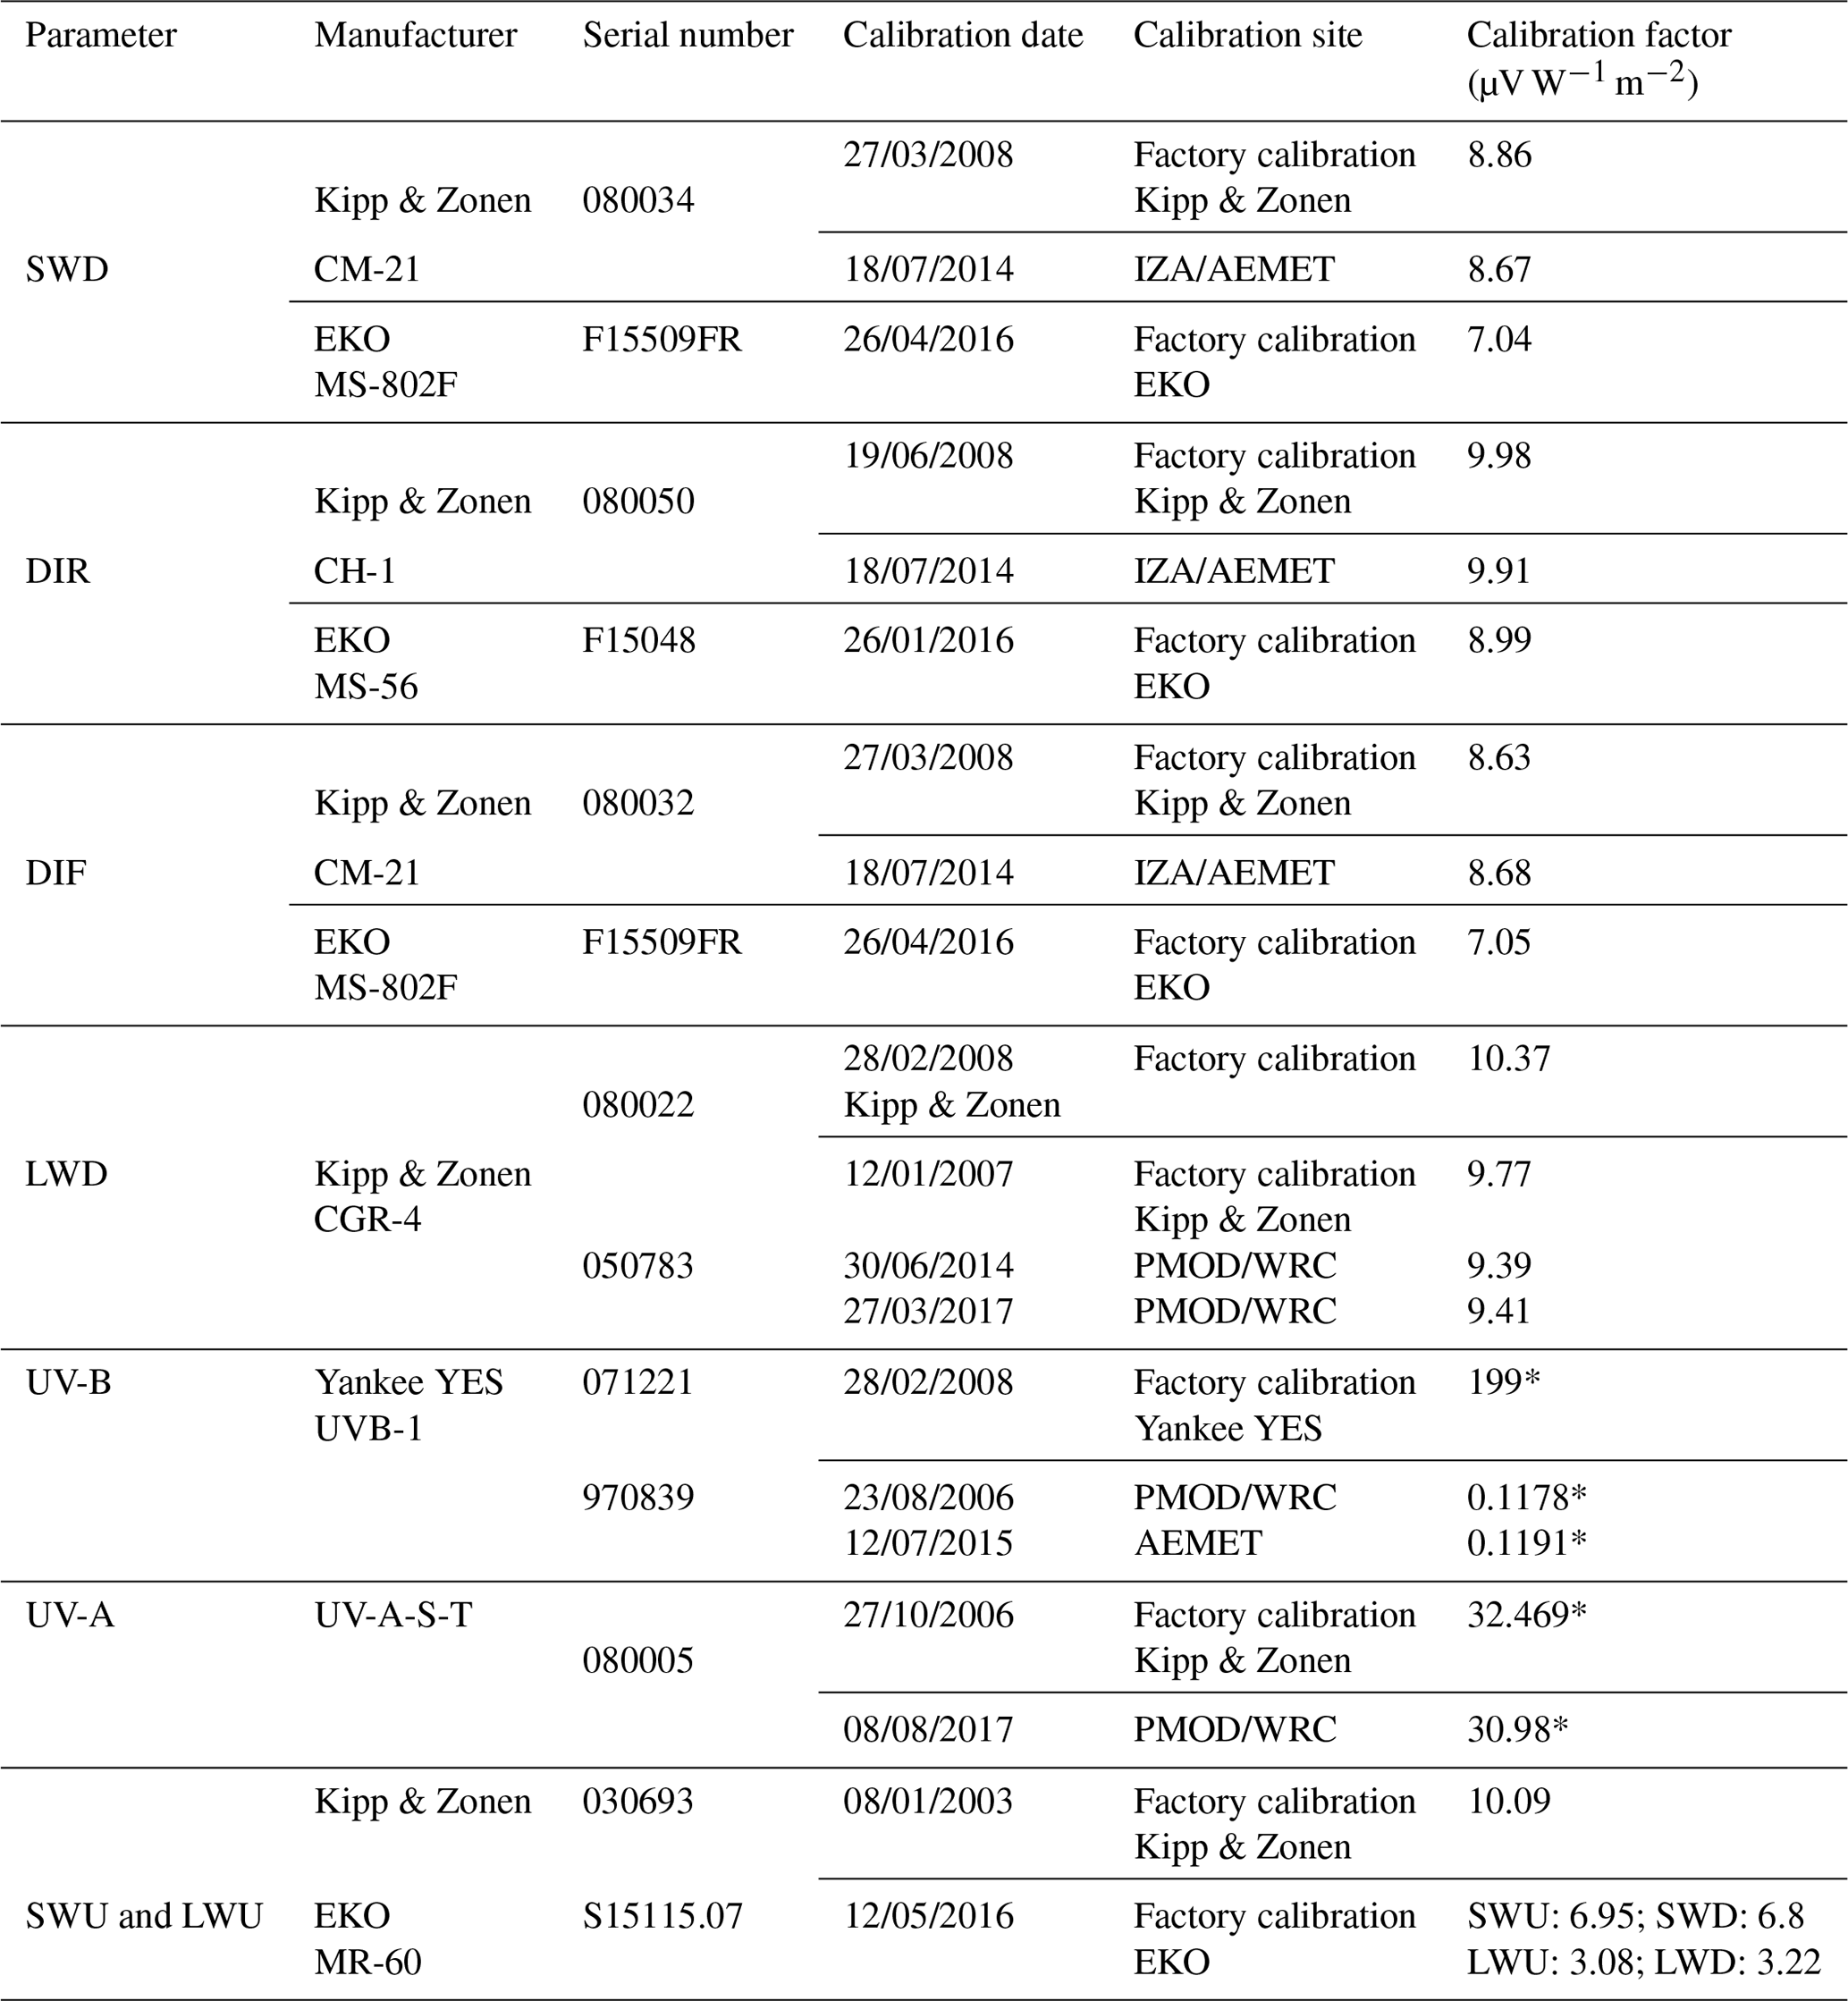
Table 1Basic-BSRN radiation instruments installed between 2009 and 2017 at IZA BSRN (SWD, DIR, DIF and LWD). The instruments currently in operation are marked in bold. WRMC is the World Radiation Monitoring Center.
Among others, the surface radiation budget and more specifically the surface Earth radiation budget (ERB) longwave and surface ERB shortwave have been identified as ECVs, due to their key role in the general circulation of the atmosphere and ocean, and the thermal structure of the atmosphere, as well as being a main factor in the Earth's climate system (König-Langlo et al., 2013). The surface ERB comprises the fluxes absorbed by the Earth's surface and the upward and downward thermal radiative fluxes emitted by the surface and atmosphere, respectively (Myhre et al., 2013).
The first surface solar radiation measurements started in the 1920s in some sites in Europe. The study of these historic datasets reveals an increase in the surface solar radiation until the 1950s, known as “early brightening” (Ohmura, 2009; Wild, 2009), but only observed in Europe due to the scarcity of available data. The study of surface solar radiation long-term records shows decadal changes with a decline of surface solar radiation from the first available records, around 1950, until the middle of the 1980s (Stanhill and Cohen, 2001; Liepert, 2002), a period known as “global dimming”, and an increment in the surface solar radiation since the middle of 1980s, a period known as “global brightening” (Wild et al., 2005).
All these studies remark on the variable quality of the data due to the technical advances in the instruments since the 1970s; thus, the confidence of the long-term trends observed should be taken into account when analyzing the results. With the aim to obtain data with the best possible quality, in the 1990s, efforts were made to establish measurement networks around the Earth with high-quality requirements to avoid introducing undesirable uncertainties in the long-term series. In this context, the Baseline Surface Radiation Network (BSRN) was proposed in 1980 by the WMO and created in 1992 to provide accurate irradiances at selected sites around the Earth, with a high temporal resolution. The BSRN is a project of the World Climate Research Programme (WCRP). In 2004, it was designated as the baseline network for GCOS. The available data cover a period from 1992 to the present thanks to the contribution of 59 stations covering various climate zones (http://bsrn.awi.de/nc/stations/maps/, last access: 7 February 2019). The BSRN data have been widely used, due to their quality and reliability in the validation of satellite observations, as input to climate models and to monitor the solar radiation reaching the Earth's surface (Ohmura, 2009).
The BSRN imposes very strict measurement requirements in order to assure the required quality of data (Long and Dutton, 2002; Long and Shi, 2006). A BSRN site must be representative of the surrounding area and avoid pollution sources, unnatural reflectance, microclimate conditions and human activities that can affect its representativity of the surroundings (McArthur, 2005). Consequently, BSRN sites cannot be located near major roadways, airports, vehicle parking areas and buildings.
In 2009, the Izaña Atmospheric Observatory (IZA, BSRN station no. 61) started its process to become a BSRN station through a specific agreement between the State Meteorological Agency of Spain (AEMET) and the University of Valladolid. IZA was proposed and accepted to be part of the BSRN at the 11th BSRN Workshop and Scientific Review meeting was held in Queenstown, New Zealand, in August 2012 (WRCP, 2012), and has since remained a member of the network without interruption.
Between 2013 and 2014, the UV-A and UV-B radiation measurements performed at IZA were used for satellite-based data validation. The validation resulted in a good agreement with satellite-based data, and it is the starting point for further developments of Flyby's elaboration processes (WRCP, 2014).
The main goal of this work is to present the status of the Izaña BSRN (IZA) between 2009 and 2017. Section 2 describes the IZA site. The main characteristics of the instruments and measurements that are part of IZA BSRN as well as instrument calibrations are presented in Sect. 3. Section 4 illustrates data processing and quality control procedures applied to the measurements, and the shipment station-to-BSRN archive. Finally, a summary and conclusions are given in Sect. 6.
IZA station (http://izana.aemet.es, last access: 7 February 2019) is managed by the Izaña Atmospheric Research Center (IARC) and is part of AEMET. It is located on the island of Tenerife (Canary Islands, Spain, at 28.3∘ N, 16.5∘ W; 2373 m a.s.l.) (Fig. 1).
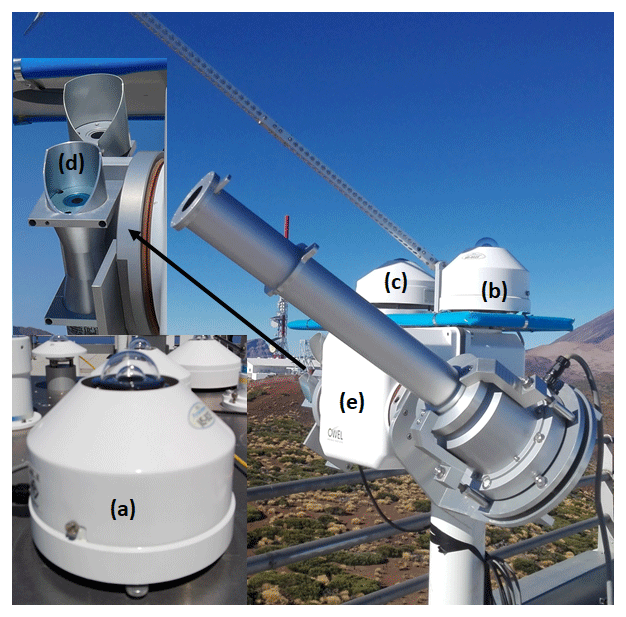
Figure 2Basic-BSRN radiation instruments currently in operation at IZA BSRN. (a) SWD: EKO MS-802F pyranometer installed on a table (horizontal); (b) DIF: EKO MS-802F pyranometer; (c) LWD: Kipp & Zonen CGR4 pyrgeometer; (d) DIR: EKO MS-56 pyrheliometer; and (e) Sun tracker: Owel INTRA 3.
Table 2Extended-BSRN radiation instruments installed between 2009 and 2017 at IZA BSRN (UV-B, UV-A, SWD and LWU). Same as Table 1.
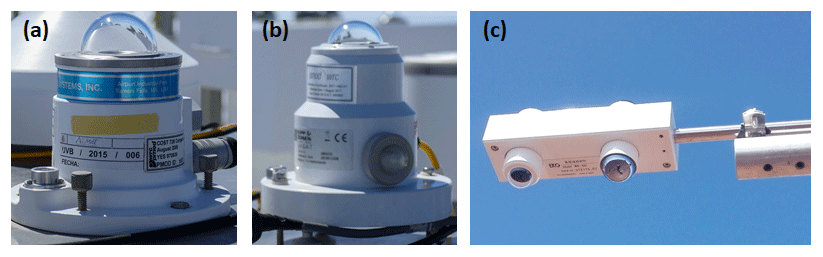
Figure 3Extended-BSRN radiation instruments currently in operation at IZA BSRN. (a) UV-B: Yankee YES pyranometer; (b) UV-A: Kipp & Zonen UV-A-S-T pyranometer; and (c) SWU and LWU: EKO M-60 net radiation sensor.
IZA is a high-mountain station above a quasi-permanent strong temperature inversion layer that prevents the arrival of local pollution from lower levels of the island. This meteorological feature favors measurements under free troposphere conditions (Cuevas et al., 2013). As a result, the climate in the area of the station is extremely dry for the majority of the year; this, together with clean air from middle/upper troposphere, gives the area a high scientific interest. Pristine conditions are alternated with periodical intrusions of the dust-laden Saharan air layer (Cuevas et al., 2015, 2017; Rodríguez et al., 2015), mainly in summertime. IZA registers the highest average annual insolation duration of Spain with about 3473 h of sunshine per year and an average of 179.5 days per year of clear days in the climate period (1981–2010) (for more information, see http://www.aemet.es, last access: 7 February 2019).
IZA enrolled in the WMO Global Atmosphere Watch (GAW) programme in 1989. In addition, IZA has contributed to several international networks such as NDACC (Network for the Detection of Atmospheric Composite Change; http://www.ndsc.ncep.noaa.gov, last access: 7 February 2019) since 1999, and GAW-PFR (Precision Filter Radiometer Network; http://www.pmodwrc.ch/worcc, last access: 7 February 2019) since 2001. In 2003, the WMO/GAW Regional Brewer Calibration Centre for Europe (RBCC-E; http://www.rbcc-e.org, last access: 7 February 2019) was established at IZA. IZA has been part of the Aerosol Robotic Network (AERONET; http://aeronet.gsfc.nasa.gov, last access: 7 February 2019) since 2004, as one of the two absolute AERONET calibration sites. IZA has also been a BSRN station since 2009 (Cuevas-Agulló, 2017). Moreover, in 2014, IZA was appointed by WMO as a CIMO (Commission for Instruments and Methods of Observation) test bed for aerosols and water vapor remote sensing instruments (WMO, 2014). A detailed description of the IZA site and its observation programs can be found in Cuevas et al. (2017).
3.1 Basic-BSRN measurements
The basic-BSRN measurements of the BSRN program at IZA are global shortwave radiation (SWD), direct radiation (DIR), diffuse radiation (DIF) and longwave downward radiation (LWD) (Table 1).

Figure 4Other instruments currently providing data to IZA BSRN: (a) radiosonde profiles, (b) the Brewer spectrophotometer and (c) SONA camera (automatic cloud observation system) installed at IZA and examples of images taken by the SONA camera.
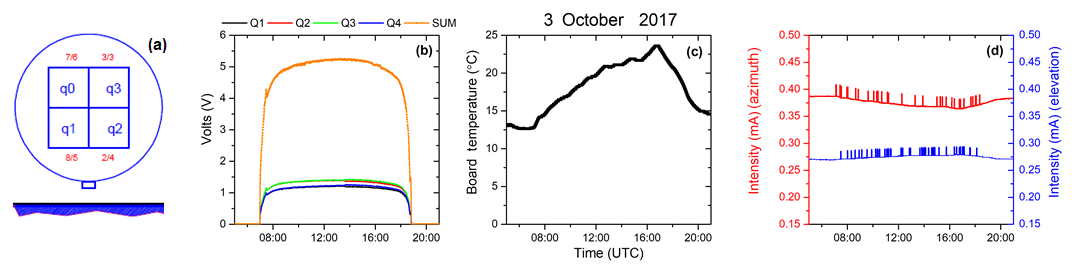
Figure 5Daily control test of the Owel INTRA solar tracker at IZA. (a) Front view of the quadrants of the Sun detector. The numbers indicated are pins of the sensor/connector, respectively; (b) Sun-sensor signals in the four quadrants and the total signal from the quadrants; (c) board temperature (∘C); and (d) current from base shunt of motor0 driver (azimuth axis, mA) (red color) and current from base shunt of motor1 driver (elevation axis, mA) (black color) (INTRA, 2010).
At present, SWD and DIF are measured with unshaded and shaded EKO MS-802F pyranometers (Fig. 2a and b) (ISO-9060 classification: secondary standard), respectively. This pyranometer is a high-precision instrument with a spectral range from 285 to 3000 nm with a response time less than 5 s (95 %, confidence level) and an expected uncertainty % for daily totals. The BSRN accuracy target for DIF and SWD is 2 % (5 W m−2) and 2 % (3 W m−2), respectively (McArthur, 2005).
DIR is measured with an EKO MS-56 pyrheliometer (Fig. 2d) (ISO-9060 classification: first class). This instrument has a full operating view angle of 5∘ and slope angle of 1∘. The spectral range covers from 200 to 4000 nm (50 % points) with a response time >1 s (95 %). The expected uncertainty is % for daily totals. The BSRN accuracy target for DIR is 0.5 % (1.5 W m−2) (McArthur, 2005). LWD is measured with a shaded Kipp & Zonen CGR4 pyranometer (Fig. 2c) (ISO-9060 classification: secondary standard). The spectral range is 4.5–42 µm (50 % points) with a response time less than 6 s (63 % response). The expected uncertainty is <3 % for daily totals (95 %). The BSRN accuracy target for LWD is 2 % (3 W m−2) (McArthur, 2005).
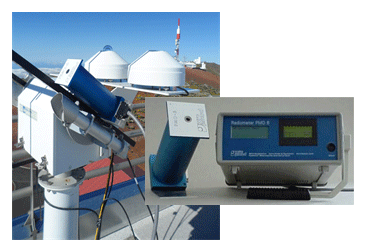
Figure 6Absolute cavity radiometer (PMO6) mounted on the IZA BSRN Sun tracker during a calibration campaign.
Table 3Summary of calibrations of the different radiation instruments performed at IZA between 2009 and 2017. PMOD is the Physikalisch-Meteorologisches Observatorium Davos, and WRC is the World Radiation Center.
* (W m−2) V−1.
These instruments are installed on a Sun tracker, with the exception of the EKO MS-802F pyranometers for SWD and DIF measurements, which are installed on a horizontal table (Fig. 2a). The Sun tracker is an Owel INTRA 3 (Fig. 2e). This is an intelligent tracker which combines the advantages of automatic-tracking operation (automatic alignment with the system of astronomical coordinates) and actively controlled tracking (a four-quadrant Sun sensor). It is constructed for use under extreme weather conditions; its operational temperature range is between −20 and 50 ∘C. It can sustain about 50 kg of carefully balanced load. The tracker motors have a special grease for use in low temperatures. It moves back to the start (morning) position at the corresponding midnight. The drive unit has a zenith rotation >90∘. The unit has an angular resolution ≤0.1∘, an angular repeatability of ∘ and an angular velocity ≥1.5∘ s−1 on the outgoing shafts. The maximum speed is 2.42∘ s−1 (Georgiev et al., 2004).
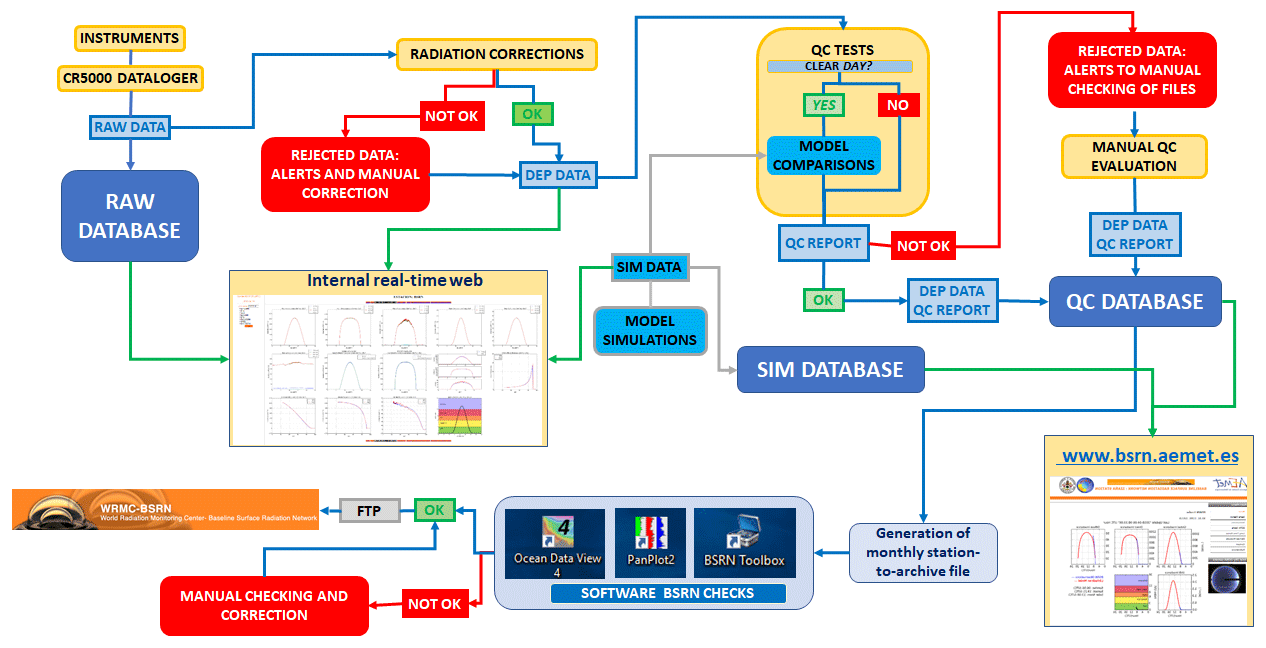
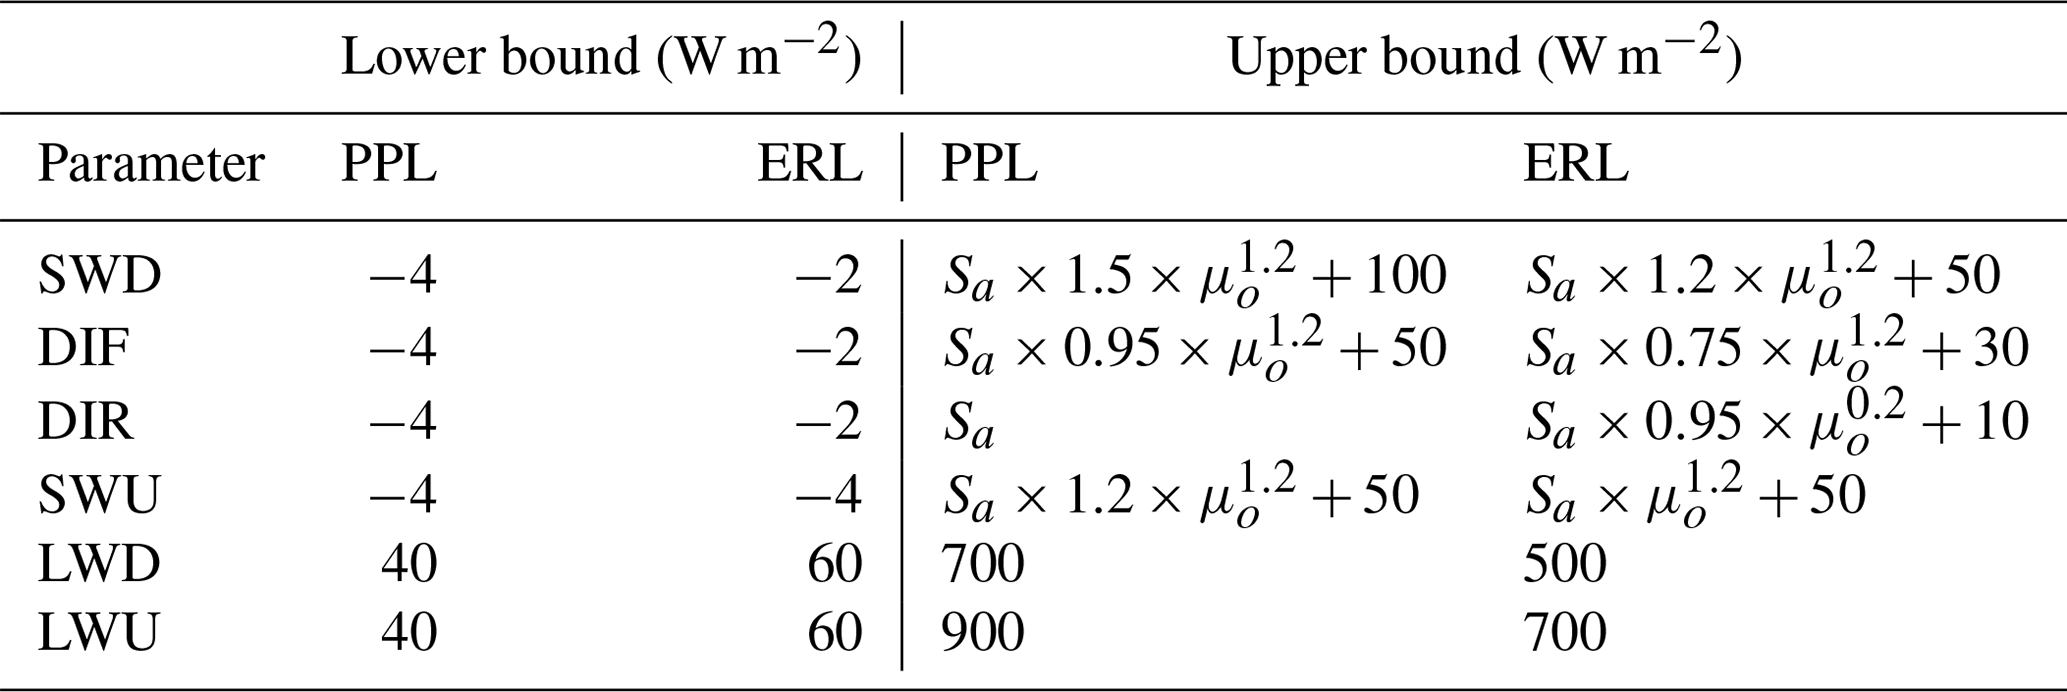
Table 4The lower and upper limits for the physically possible limits (PPLs) and extremely rare limits (ERLs) used in flagging the radiation measurements. µo is the cosine of the solar zenith angle and Sa is the solar constant adjusted for the Earth–Sun distance.
In addition, the measurements of pressure (P), relative humidity (RH) and temperature (T) are included in this measurement group. The pressure is measured a with Setra 470 pressure transducer, and RH and T are measured with Campbell Scientific CS215-L sensors.
3.2 Extended-BSRN measurements
The extended-BSRN measurements included in the IZA BSRN program are shortwave upward radiation (SWU), ultraviolet measurements (UV-A and UV-B) and longwave upward radiation (LWU) (Table 2).
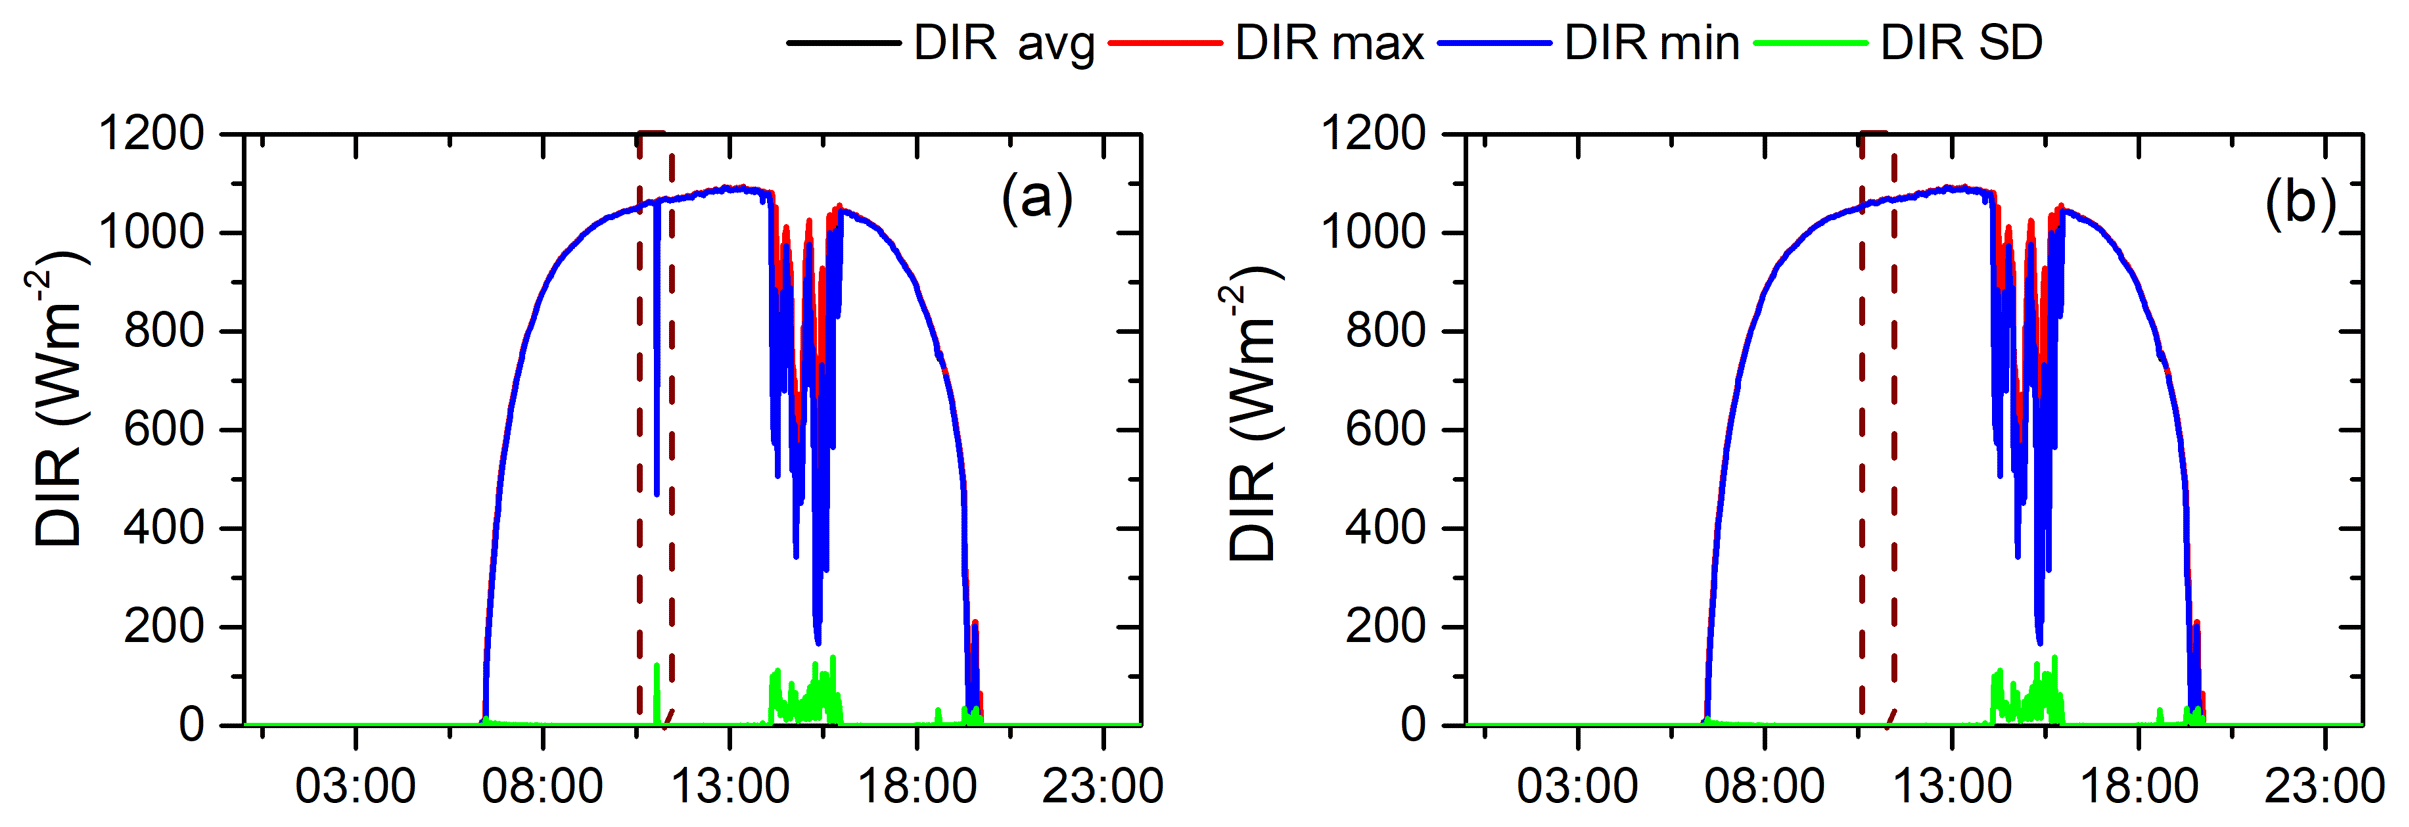
Figure 8Example of data-removing process. The rejected data were caused by shadows during cleaning operations. The dashed line represents the pyrheliometer cleaning time (a) before removing rejected data and (b) after removing rejected data.
A Yankee YES pyranometer (Fig. 3a) measures global radiation in the UV-B spectral range from 280 to 315 nm with a response time around 100 ms. The UV-A (315–400 nm) is measured with a Kipp & Zonen UV-A-S-T pyranometer (Fig. 3b) with a response time less than 1.5 s (95 %). The expected uncertainty is <5 % for daily totals (95 %). SWU and LWU are measured with a MS-60 EKO radiometer (Fig. 3c) (ISO-9060 classification: secondary standard). This system is formed by two pyranometers and two pyrgeometers. The spectral range of the pyranometers is 280–3000 nm with a response time ∼17 s, while the spectral range of the pyrgeometers is 3–50 µm.
The radiation measurements are acquired with a Campbell CR5000. This data logger is a rugged, high-performance data-acquisition system with a built-in keyboard, graphics display and PCMCIA card slot. It combines a 16-bit resolution with a maximum of 5000 measurements per second. In particular, the measurements are taken with a time step of 5 s. The minimum, average, maximum and standard deviation are stored every minute.
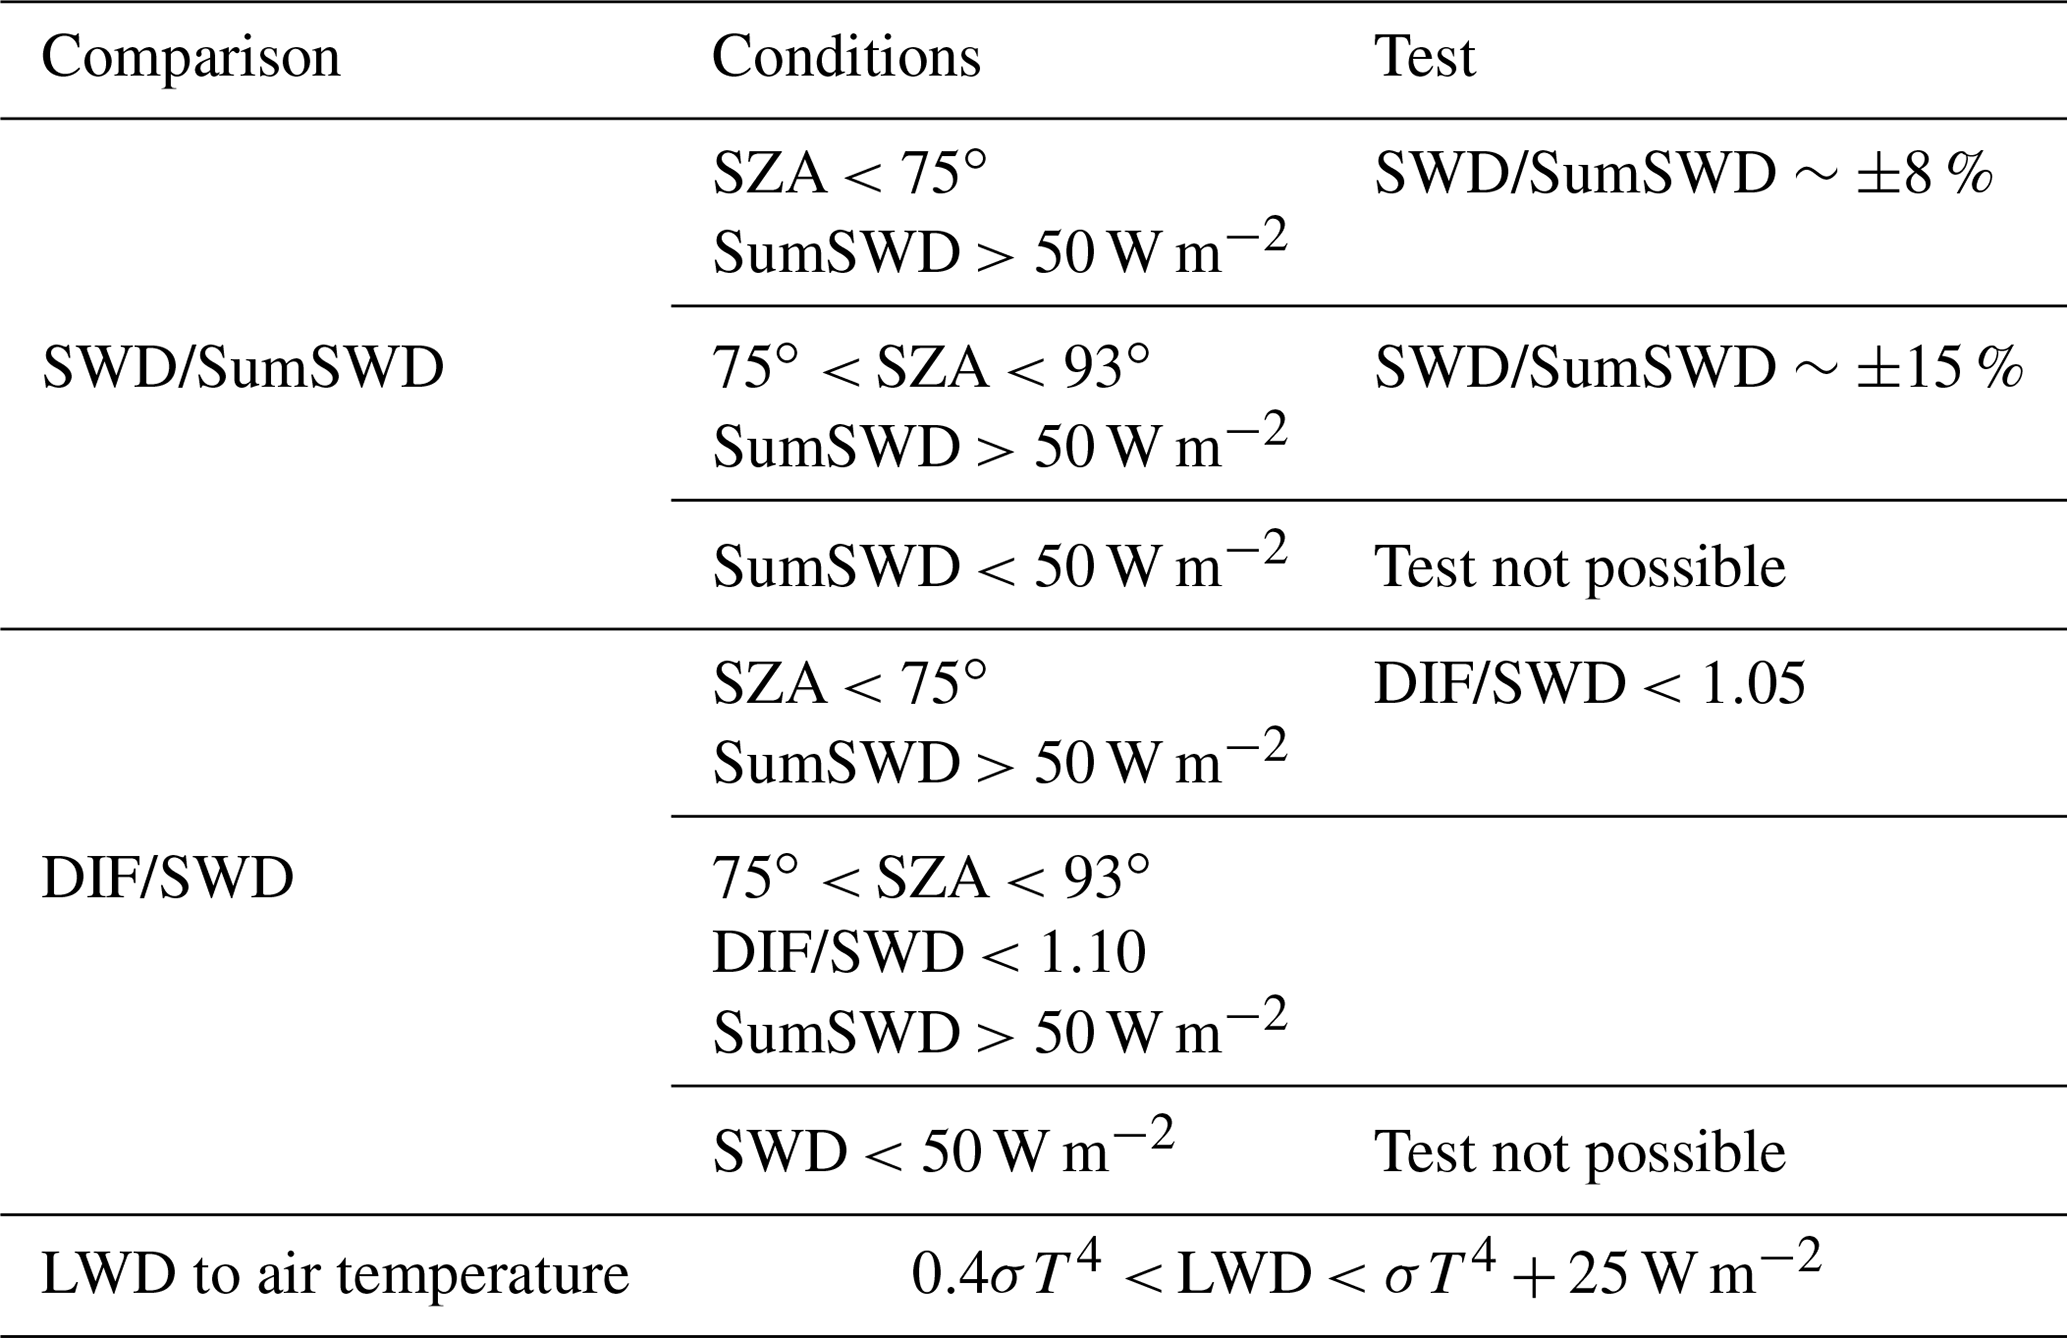
Table 5Same as Table 4 except for the “comparison” intervals used for flagging the radiation quantities. σ is the Stefan–Boltzmann constant ( W m−2 K4), SZA is solar zenith angle, T is air temperature (K), and SumSWD is DIR × cos(SZA) + DIF.
3.3 Ancillary measurements
Ancillary measurements, such as radiosonde data (Fig. 4a) and total ozone column (TOC), are performed at IZA BSRN station.
Vertical profiles of pressure, temperature, relative humidity and wind direction and speed are measured using Vaisala RS92 radiosondes (Carrillo et al., 2016; Cuevas et al., 2017) that are launched twice a day, at 00:00 and 12:00 UTC at the Güimar station (WMO GRUAN station no. 60018; 105 m a.s.l.), managed by the Meteorological Centre of Santa Cruz de Tenerife (AEMET). This station is located near the coastline at a distance in a straight line from IZA of ∼15 km. The TOC measurements are performed with the Brewer spectrophotometer (Fig. 4b) (precision better than 1 %) (Redondas and Cede, 2006). An automatic cloud observation system (SONA camera) (Fig. 4c) (González et al., 2013) developed by Sieltec Canarias S.L. takes all-sky images every 5 min, day and night. This camera consists of a resolution of 640×480 pixels and an 8-bit color response CCD sensor with a Bayer filter, with a spectral range from 400 to 700 nm. A rotating shadow band is used for protecting the sensor from direct sunlight.
3.4 Instrument checks and maintenance
All the instruments of the BSRN are checked on a daily basis by meteorological observers of the Izaña observatory. Routine checks consist of cleaning the domes, cable connections inspection and instrument leveling, as well as checking the proper functioning of the solar tracker and shading system of the instruments for DIF and LWD measurements. Recently, a tool to test the Owel INTRA solar tracker real-time check-up has been implemented. This test consists in controlling the four quadrants of the solar tracker (see Sect. 3.1), checking its leveling, the board temperature and the intensity of the base shunt of motor in azimuth and elevation axis (Fig. 5).
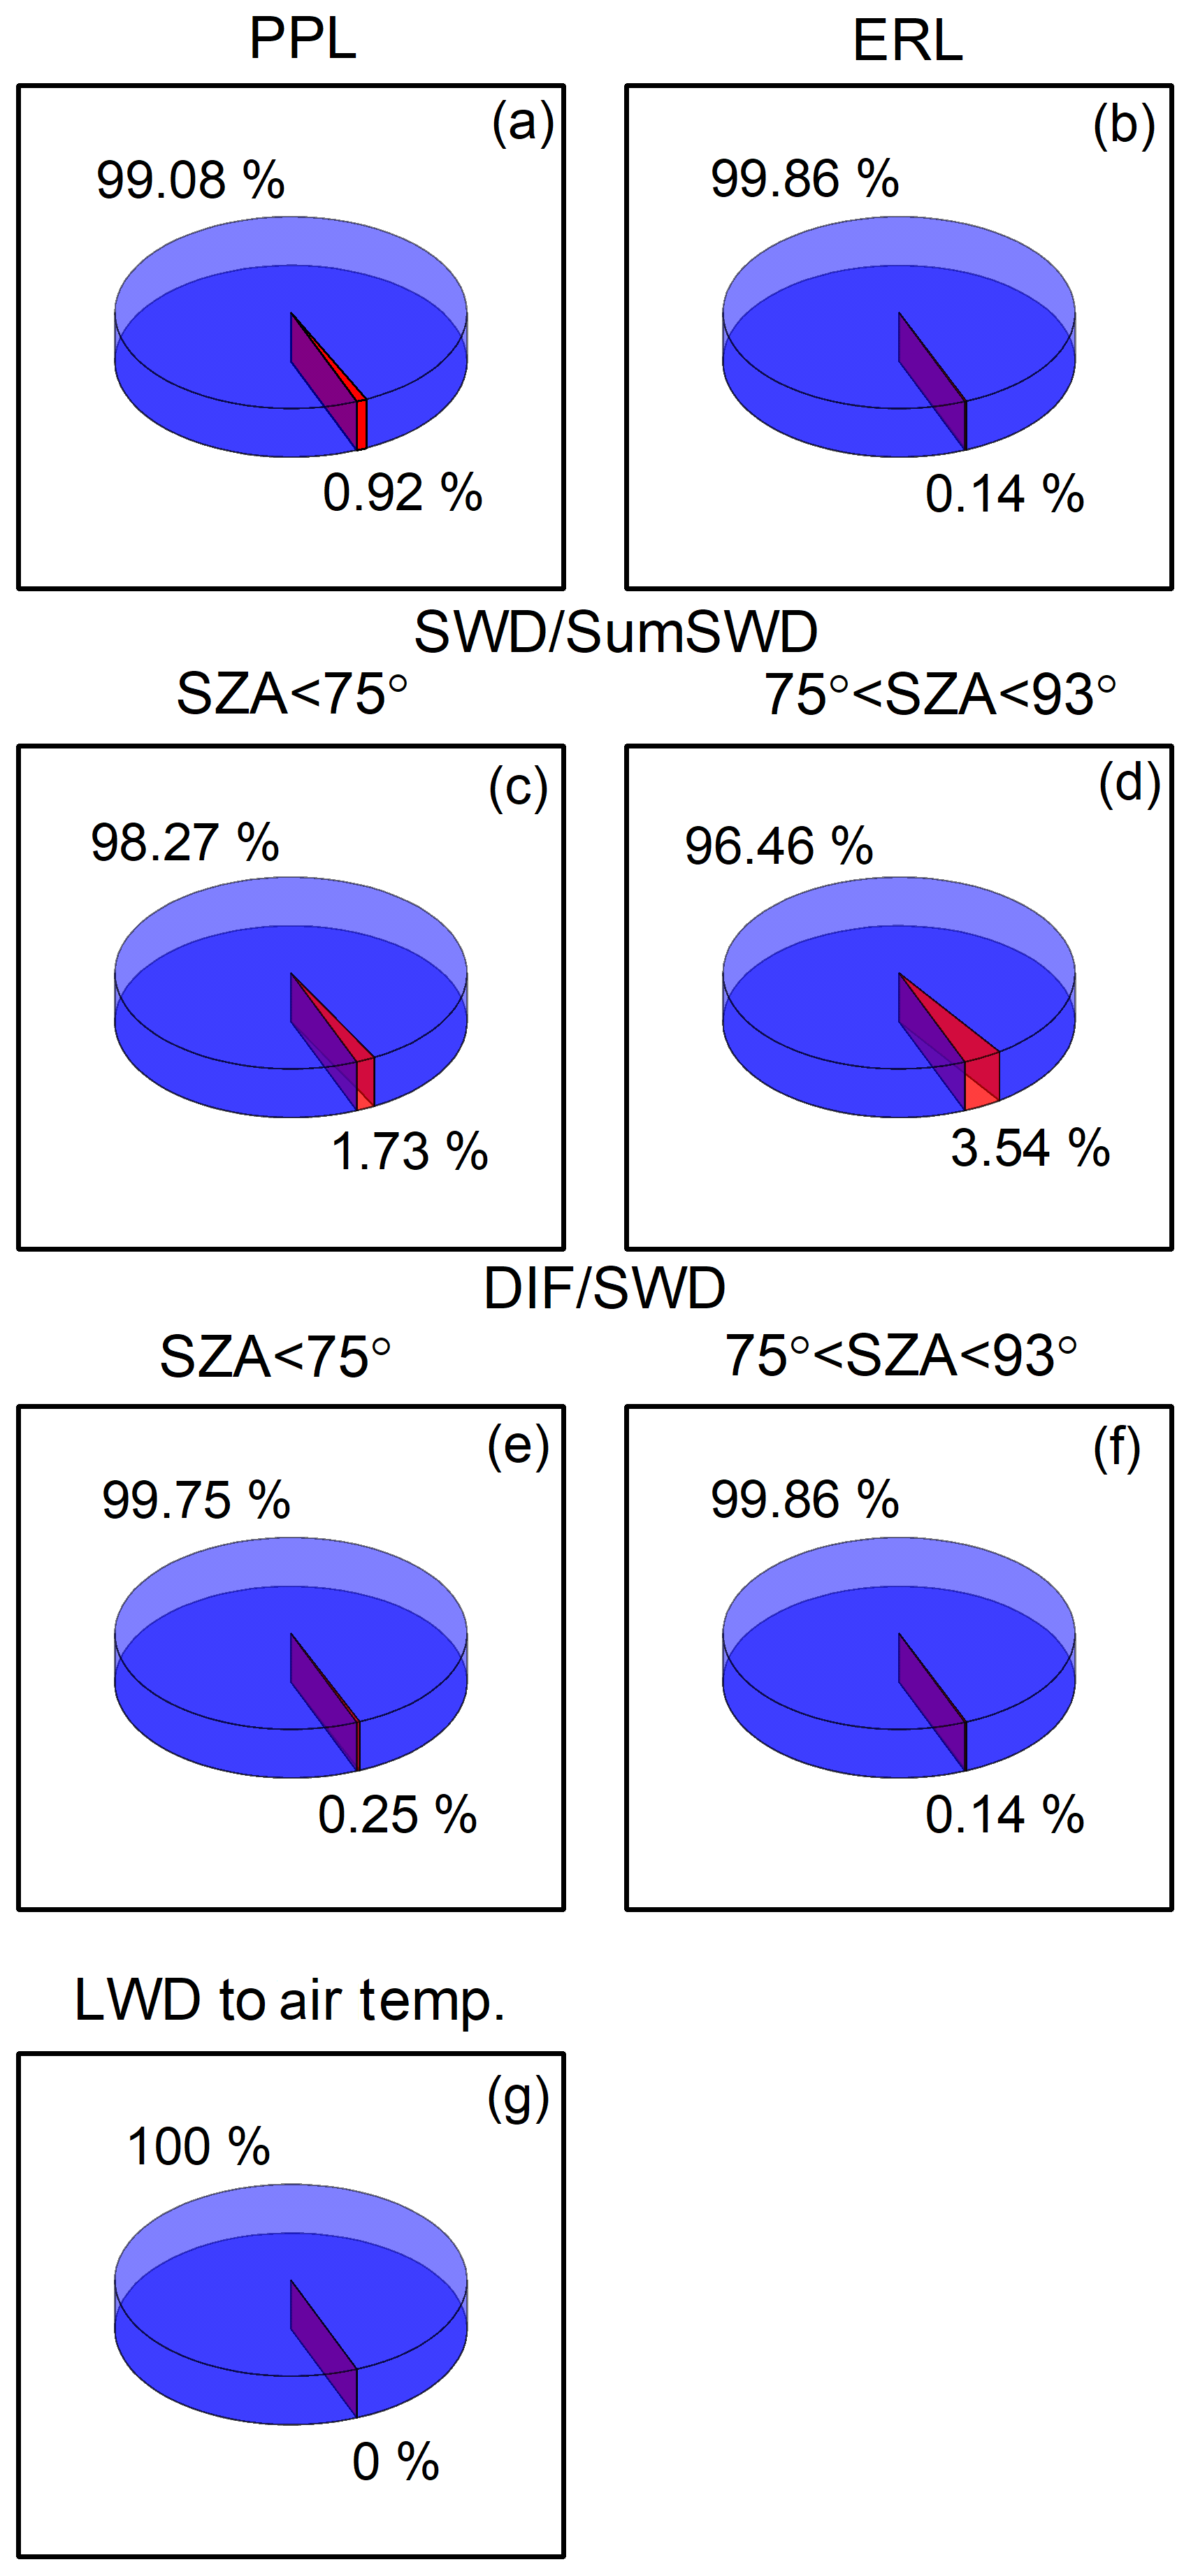
Figure 9Percentage of rejected data (red color) and accepted data (blue color) according to the PPLs and ERLs, and comparison of various irradiance components (SWD, SumSWD, DIF, LWD and air temperature) at IZA between 2009 and 2017.
3.5 Instrument calibrations
All the radiation instruments (Tables 1 and 2) have been periodically calibrated following the recommendations of the BSRN (Table 3) and are regularly compared with reference instruments with recent calibration from the World Radiation Center (WRC) at Davos.
An absolute cavity pyrheliometer PMO6 designed at PMOD (Physikalisch-Meteorologisches Observatorium Davos) (Fig. 6) that is regularly calibrated at the WRC is used as a reference instrument and is directly traceable to the World Radiometric Reference. Periodical calibrations with PMO6 allow us to assure the reliability of the measurements and correct time degradation on the calibration constants. A large calibration campaign of BSRN pyranometers and pyrheliometers was performed during 2014 using the aforementioned PMO6. The ISO 9059:1990(E) and ISO 9846:1993(E) recommendations were met. The calibration of a field pyranometer/pyrheliometer by means of a reference pyrheliometer is accomplished by exposing the two instruments to the same solar radiation and comparing their corresponding measurements. This allows us to compare target instruments to high-accuracy radiation sensors. A second calibration campaign was held in July–August 2018.
During 2009, a BSRN database was developed in order to manage the large volume of BSRN data. This tool not only allows the management of a large volume of information that is automatically generated, but it is also used for checking of real-time measurements and becoming a comprehensive quality control system with corresponding alarms.
The BSRN data management flowchart is shown in Fig. 7. It includes daily and monthly semi-automatic processes to collect and check the measurements, and generate the station-to-archive file sent every month to the BSRN database. This daily process can be executed automatically, or on demand, producing several warning alerts if human checking is needed.
Data are stored in a CR5000 data logger (see Sect. 3.2). This data logger generates a raw data file that is stored in a database for further analysis, if necessary, which is also available on an internal web for real-time access. The raw data file is checked in order to assess the format integrity and detect gaps.
Stamnes et al. (1988, 2000)Rodriguez-Franco and Cuevas (2013)Kurucz (1992)Bass and Paur (1985)Pierluissi and Peng (1985); Ricchiazzi et al. (1998)García et al. (2014)León-Luis et al. (2018)Holben et al. (1998)Holben et al. (1998)Holben et al. (1998)Holben et al. (1998)Shettle (1990)Table 6The input parameters of the LibRadtran model, their sources and corresponding references.
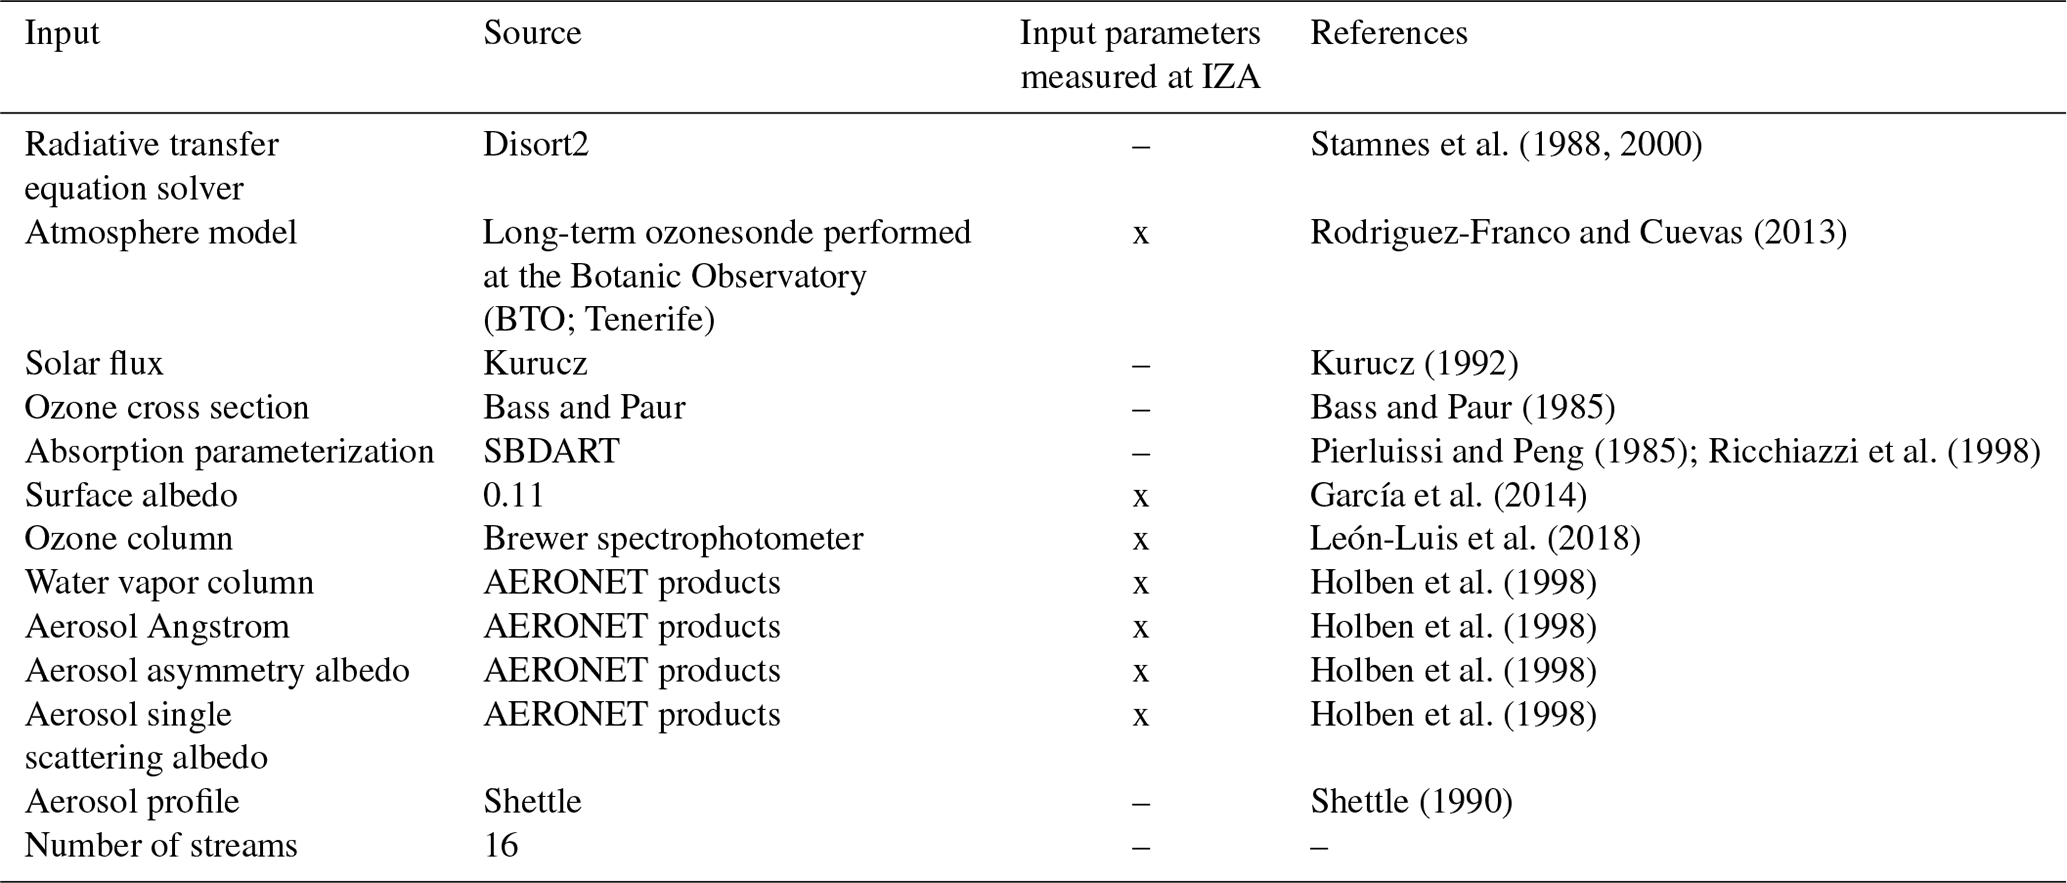
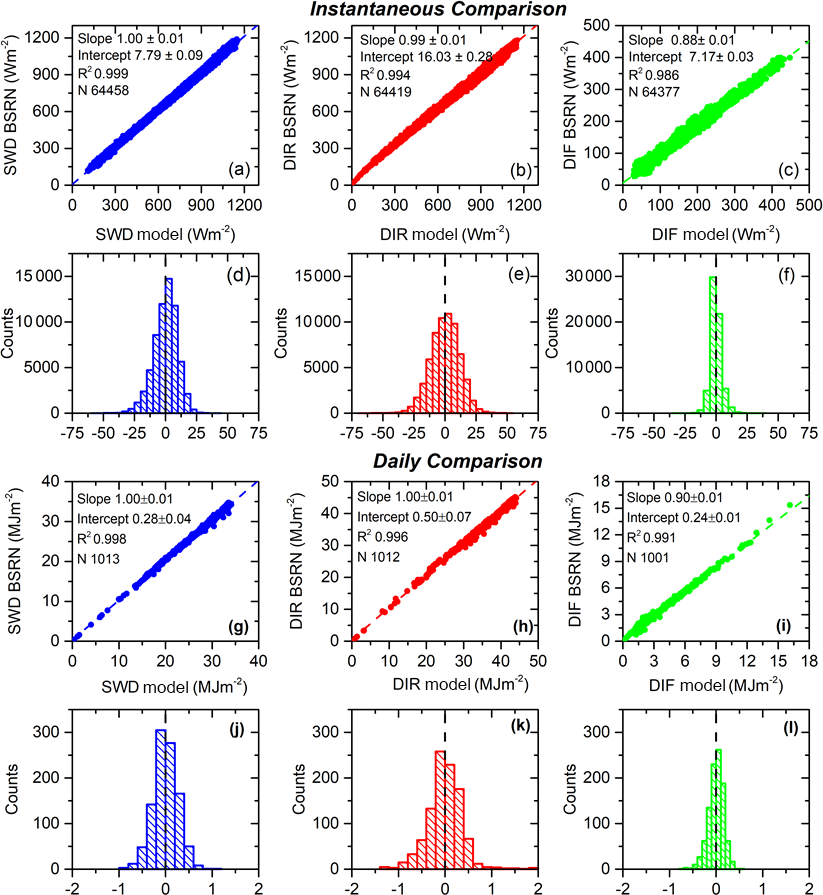
Figure 10Scatterplots and histograms of the instantaneous (W m−2) and daily (MJ m−2) radiation measurements and simulations for the period 2009–2017: (a, d, g, j) SWD, (b, e, h, k) DIR and (c, f, i, l) DIF. The fitting parameters are shown in the legend.
4.1 Measurement radiation corrections
Several corrections are applied to raw data to obtain the final radiation data. These corrections are as follows:
-
Zero offset: This is defined as the signal caused by changes in the instrument temperature. The zero offset is measured for each instrument as part of the observation sequence when possible. For instruments that are not capable of obtaining a zero offset with each observation, it is measured at night and subtracted from daytime values (McArthur, 2005). The average values of zero offset compared to the radiation values performed during the day are rather small, representing 0.3 % and 0.02 % of the SWD and DIR signals for 1000 W m−2, respectively (García Cabrera, 2011).
-
Cleaning operations: As remarked in Sect. 3.4, daily cleaning of domes is performed. Some artificial shadows are caused when the observers perform these operations. Data corresponding to cleaning activities are identified and removed from the database (Fig. 8).
-
Exceptional situations: Shadows or gaps in raw data are also observed due to exceptional situations, such as severe weather, repairing of instruments and maintenance operations, etc. Data stored during these non-operational periods are also removed from the database.
4.2 Quality control (QC)
Once the corrections are made, a Dep data file is obtained, which will be used to perform the quality control (QC) tests. The IZA QC procedure has two main parts: the recommended BSRN controls and the comparison with simulations with radiative transfer models (RTMs).
The first part of the QC consists of applying the QC methods that the WRMC recommends to the BSRN data (Gilgen et al., 1995; Ohmura et al., 1998; Long and Dutton, 2002; Long and Shi, 2006, 2008). These quality control procedures are based on checking whether the measurements are within certain limits: physically possible limits (PPLs), extremely rare limits (ERLs) and the comparison of various irradiance components.
The PPL procedure is introduced for detecting extremely large errors in radiation data, while the ERL procedure is used to identify measurements exceeding the extremely rare limit. Radiation data exceeding these limits normally occur under very rare conditions and over very short time periods. These tests are based on empirical relations of different quantities (Table 4).
The final BSRN QC procedure is the comparison of various radiation components, i.e., the ratio between the DIR, directly measured with a pyrheliometer, and the derived value from the difference between the SWD and DIF (SumSWD), and the ratio between DIF and SWD. These tests capture smaller errors that have not been detected by the PPL and ERL procedures (Table 5).
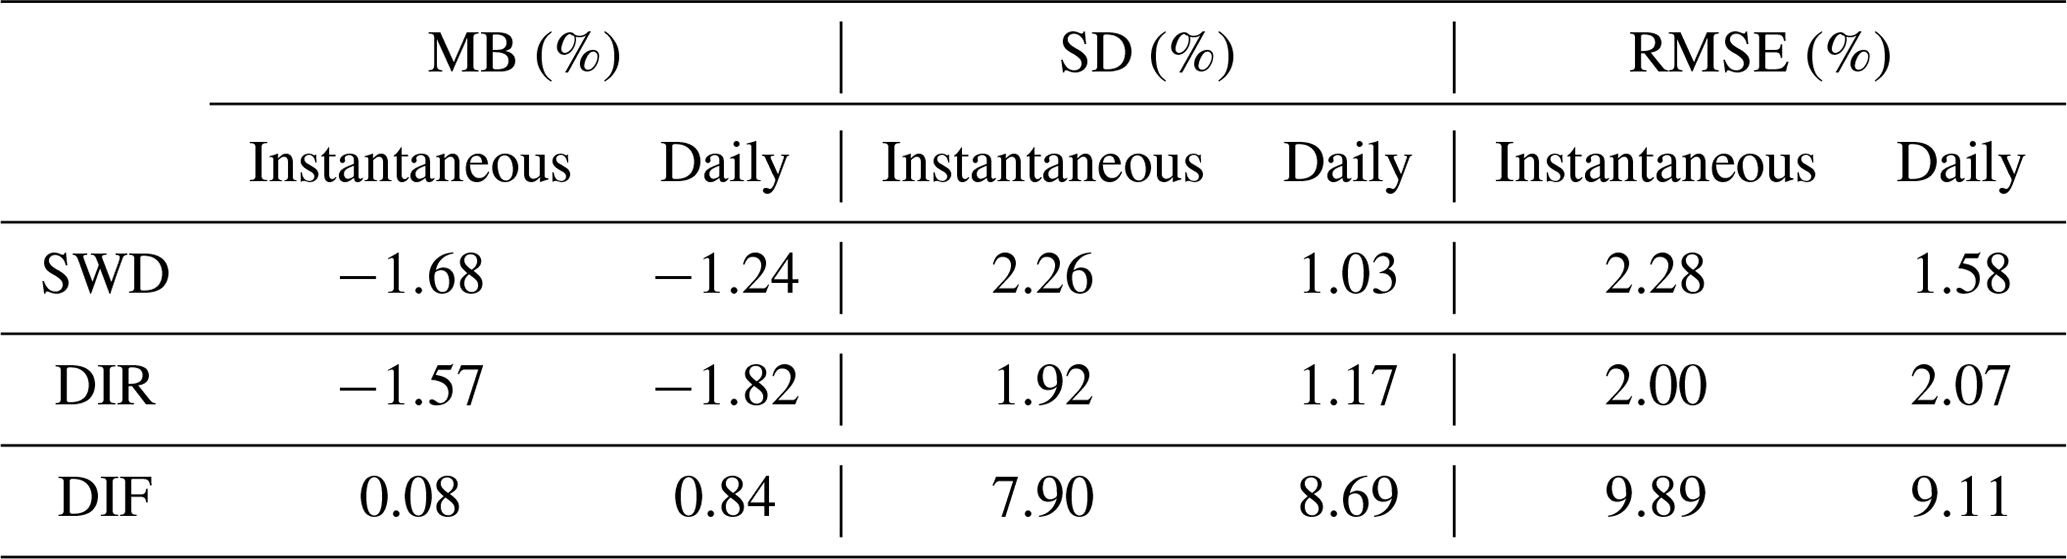
Table 7Statistics for the bias between instantaneous and daily SWD, DIR and DIF simulations and measurements at IZA BSRN for the period 2009–2017. MB is mean bias; SD is standard deviation; RMSE is root mean square error.
At IZA, the measurements' quality assessment is performed taking into account the tests described above, by using the BSRN Toolbox software (Schmithüsen et al., 2012) developed for the BSRN community and WRMC. This software also includes a data format check for the station to archive files and for PANGAEA download files (see below). Data quality checks as outlined in the BSRN global network recommended QC tests V2.0 (Long and Dutton, 2002) can also be performed with this software. We have found that <1 % of all radiation measurements at IZA are outside the PPL and ERL limits (see Fig. 9a and b) between 2009 and 2017 for solar zenith angles (SZAs) <90∘.
The ratio between the different components also confirms the high quality of the SWD, DIR and DIF measurements. For SWD/SumSWD and SZA <75∘, >98 % (Fig. 9c) of the data are between 0.92 and 1.08, while for 75∘ < SZA <93∘, 96 % of the measurements range from 0.85 to 1.15 (Fig. 9d). For DIF/SWD, the results present a high quality with 99 % within the established limits, for both SZA <75∘ and 75∘ < SZA < 93∘ (Fig. 9e and f). The IZA radiation measurements largely meet the BSRN quality controls.
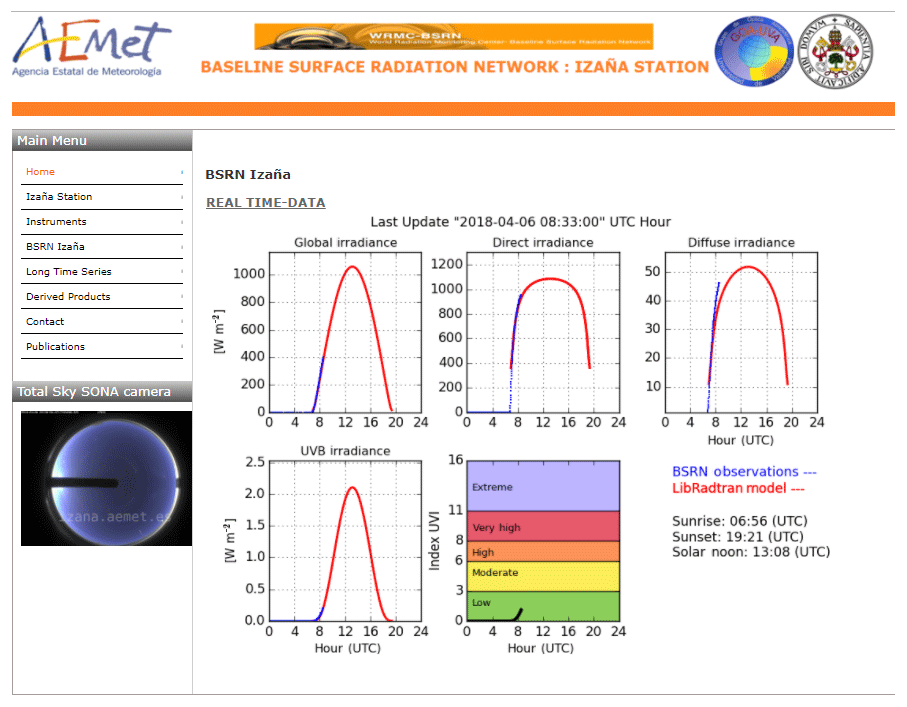
Figure 11BSRN Izaña station home page (http://www.bsrn.aemet.es, last access: 7 February 2019).
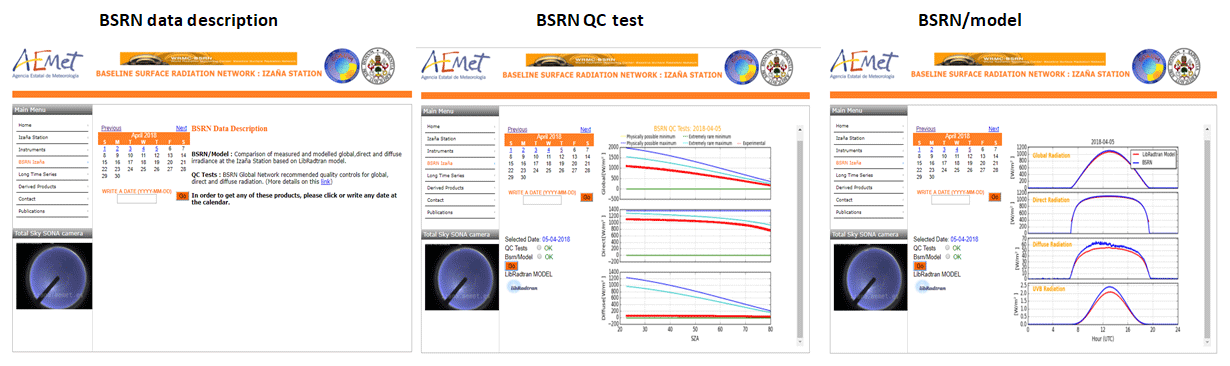
Figure 12BSRN Izaña: BSRN data description, QC test (BSRN global network recommended QC for SWD, DIR and DIF) and BSRN–model comparison for SWD, DIR, DIF and UV-B radiation at IZA using the LibRadtran RTM (http://www.bsrn.aemet.es, last access: 7 February 2019).
The second part of the QC is the comparison of instantaneous and daily radiation measurements with simulations performed with RTMs during clear periods. An adaption of Long and Ackerman's method (Long and Ackerman, 2000) for IZA, performed by García et al. (2014), is used for detecting instantaneous clear-sky periods. This method is based on 1 min SWD and DIF measurements to which four individual tests are applied to normalized SWD, maximum DIF, change in SWD with time and normalized DIF ratio variability.
Following the BSRN recommendations, the instantaneous clear-sky periods detected are simulated and compared with instantaneous and daily radiation measurements. The RTM model used is LibRadtran (http://www.libradtran.org, last access: 7 February 2019; Mayer and Kylling, 2005; Emde et al., 2016), which has been extensively tested at IZA (García et al., 2014, 2018). The measured input parameters used in the LibRadtran model simulations are shown in Table 6. The model input parameters – precipitable water vapor (PWV), aerosol optical depth (AOD), total ozone column and surface albedo – are measured at IZA (García et al., 2014, 2018). The straightforward comparison between the instantaneous and daily SWD, DIR and DIF simulations and measurements shows an excellent agreement (Fig. 10). The variance of daily (instantaneous) measurements overall agrees within 99 % (98 %) of the variance of daily (instantaneous) simulations.
The simulations slightly underestimate the instantaneous/daily measurements of SWD (−1.68 % %) and DIR (−1.57 % %), while the DIF simulations overestimate the instantaneous/daily measurements (0.08 %∕0.84 %). The RMSE is <2.5 % for SWD and DIR for both instantaneous and daily comparisons, while for DIF it increases to 9.89 % and 9.11 % for instantaneous and daily comparisons, respectively (Table 7). These results are in agreement with those obtained by García et al. (2014).
4.3 Web tool
With the aim to have, at a glance, an overview of the state of the BSRN station, a web site has been developed for the IZA BSRN station (Fig. 11; http://www.bsrn.aemet.es, last access: 7 February 2019). Plots for several variables such as SWD, DIR, DIF, UV-B and UVI index are automatically available at the home web page, as well as corresponding simulations performed with actual input data at the IZA station. These plots are provided in near-real time (every 10 min).
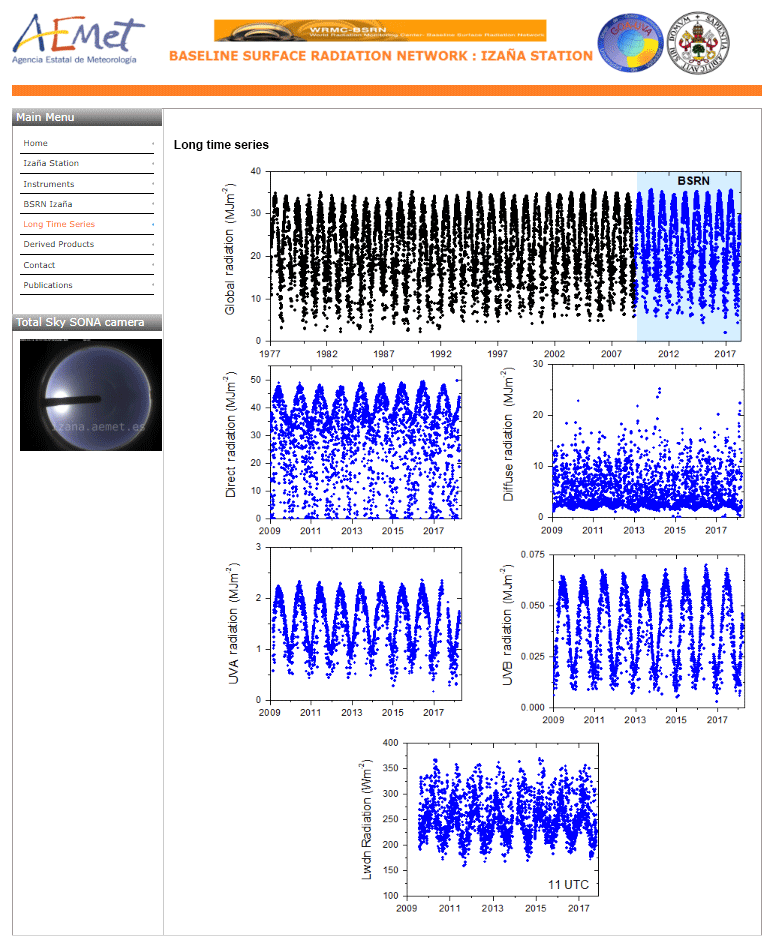
Figure 13IZA time series of daily SWD, DIR, DIF, UV-A and UV-B measurements, and instantaneous LWD data series (11:00 UTC) for the period 2009–2017.
On the web page, there are links to the comparison between measurements and simulations, QC control results, long-term series and derived products, among other additional information. Additional information on the installed instrumentation and the BSRN-related publications is also available (Fig. 12). In the following paragraphs, we present a short description of the BSRN Izaña, long-term series and derived products.
-
BSRN Izaña: In this menu, it is possible to select any date and plot the results of applying the QC recommended by the BSRN (see Sect. 4.2) for SWD, DIR and DIF. It is also possible to plot the comparison of measured and simulated SWD, DIR, DIF and UV-B radiation at IZA using LibRadtran RTM and input parameters measured at IZA. This section of the web is automatically updated every night, once the measured input parameters for the model are available, and the QC tests are applied, according to the flowchart shown in Fig. 7.
-
Long-term series: Daily values of SWD, DIR, DIF, UV-A and UV-B measurements and instantaneous (11:00 UTC) values of LWD are correspondingly updated on the web (Fig. 13). SWD measurements started in 1977 with a bimetallic pyranometer (PYR) being replaced in 1992 by different instruments (Kipp & Zonen: CM-5, CM-11 and CM-21) (García et al., 2017).
-
Derived products: From DIR measurements and following the methodology developed by Ellis and Pueschel (1971), the apparent transmission is automatically calculated for the purposes of monitoring clear-sky solar transmission (Fig. 14). This apparent transmission is defined as the ratio of the output from a normal-incidence pyrheliometer for a specific pair of SZA corresponding to integer air masses on the morning of a given day:
where Idir is DIR, ITOA is the top of the atmosphere (TOA) irradiance, ma is absolute air mass and h is solar elevation angle.

Figure 14Data time series of direct solar radiation atmospheric transmission determined at IZA for the period 2009–2017.
4.4 Station-to-BSRN archive file
The last step in the IZA data management is to create the station-to-archive file, which is submitted to the BSRN database on a monthly basis. This procedure is performed using the radiation measurements (Sect. 3.1 and 3.2), radiosonde profiles and total ozone data (Sect. 3.3).

Figure 15Example of (a) visualization of daily data of SWD, DIR, DIF and LWD radiation at IZA on August 2017 (software: PanPlot; Sieger and Grobe, 2013) and (b) intercomparison between SWD on the x axis and SumSWD (defined as the sum of DIF and DIR on a horizontal plane) on the y axis calculated using the BSRN Toolbox (Schmithüsen et al., 2012).
As shown in Fig. 7, the process includes the application of QC tests again to the radiation data using the specific software tools developed by the BSRN. A visual inspection of the monthly data series is made to avoid outliers or detect erroneous data of the different variables before submitting the file to the BSRN database (Fig. 15). Finally, if the checks are correct, the station-to-archive file is sent by ftp (http://ftp.bsrn.awi.de, last access: 7 February 2019).
A detailed description of the BSRN database has recently been published by Driemel et al. (2018). In this paper, some end-user applications of the IZA BSRN data are described.
The IZA BSRN data have been used in diverse research works encompassing several research fields. The most recent publications that have used the IZA BSRN data as part of their work are listed in Table 8, grouped by the research field. Here, we only remark on the peer-reviewed works but it should be noted that there are many contributions and proceedings that are related also to a greater or lesser extent to the IZA BSRN data.
Bolsée et al. (2016)Borges et al. (2016)Borges et al. (2017)García et al. (2014a)García et al. (2014b)García et al. (2016)García et al. (2017)García et al. (2014)Linares-Rodriguez et al. (2015)Quesada-Ruiz et al. (2015)Antonanzas-Torres et al. (2016)García et al. (2018)Urraca et al. (2018)Kosmopoulos et al. (2018)García et al. (2015)Schroedter-Homscheidt et al. (2017)Yu et al. (2018)Schroedter-Homscheidt et al. (2018)Stathopoulos and Matsoukas (2018)Lenz et al. (2017)Hofmann and Seckmeyer (2017)Smith et al. (2016)Table 8Publications that used the IZA BSRN data in the last 5 years.
In future research, the IZA BSRN data will be essential to accurately analyze the attenuation of different types of clouds in UV, visible and infrared radiation, and to study the optical and radiative properties of mineral dust, as well as for solar energy applications, such as solar radiation nowcasting.
The Izaña station has been part of the BSRN since 2009. IZA BSRN contributes with basic-BSRN radiation measurements: global shortwave radiation (SWD), direct radiation (DIR), diffuse radiation (DIF) and longwave downward radiation (LWD); extended-BSRN measurements: ultraviolet radiation (UV-A and UV-B), shortwave upward radiation (SWU) and longwave upward radiation (LWU); and other measurements: vertical profiles of temperature, humidity and wind obtained from radiosonde profiles (WMO station no. 60018) and total ozone column thickness from the Brewer spectrophotometer.
Following the recommendations of the BSRN, the quality control tests have been routinely applied. The analysis of the QC results shows very good data quality that meets the BSRN requirements. The percentage of measurements that are outside the PPLs and ERLs is <1 % for SZA <90∘ in the period 2009–2017. The ratios between components also provide good results, with >98 % of measurements within the limits for SZA <75∘. The poorest result is the SWD/SumSWD for 75∘ < SZA <93∘ with >96 % of measurements within the defined limits.
In addition, we have compared the instantaneous and daily SWD, DIR and DIF measurements with simulations obtained with the LibRadtran RTM. The observed agreement between measurements and simulations is very good: the variance of daily and instantaneous measurements overall agrees within 99 % and 98 %, respectively. The simulations underestimate the instantaneous/daily measurements of SWD (−1.68 % %) and DIR (−1.57 % %), while DIF simulations overestimate the instantaneous/daily measurements (0.08 %∕0.84 %). The RMSE is lower than 2.5 % for SWD and DIF for both instantaneous and daily comparisons. These results demonstrated a high consistency between the measurements and simulations reinforcing the reported data quality. The results show also the usefulness of the RTM as a tool for quality control radiation measurements over time.
The BSRN Izaña radiation measurements are available at https://doi.org/10.1594/PANGAEA.882526 (Cuevas-Agulló, 2017).
-
Global shortwave radiation (SWD) is the radiation received from a solid angle of 2π sr on a horizontal surface in a spectral range between 285 and 3000 nm. The SWD on a horizontal surface is equal to the direct normal radiation multiplied by the cosine of the solar zenith angle plus the diffuse irradiance (WMO, 2014).
-
Direct radiation (DIR) is the radiation measured at the surface of the Earth at a given location with a surface element perpendicular to the Sun in a spectral range between 200 and 4000 nm (WMO, 2014).
-
Diffuse radiation (DIF) is the radiation measured on a horizontal surface with radiation coming from all points in the sky excluding circumsolar radiation in a spectral range between 285 and 3000 nm (WMO, 2014).
-
Longwave downward radiation (LWD) is thermal irradiance emitted in all directions by the atmosphere: gases, aerosols and clouds as received by an horizontal upward facing surface in a spectral range between 4500 and 42 000 nm (WMO, 2014).
-
Ultraviolet radiation (UV-B) is the radiation received from a solid angle of 2π sr on a horizontal surface spectral range between 280 and 315 nm (WMO, 2014).
-
Ultraviolet radiation (UV-A) is the radiation received from a solid angle of 2π sr on a horizontal surface spectral range between 315 and 400 nm (WMO, 2014).
The paper was prepared by RDG and EC with contributions from all co-authors. RDG was responsible for the data QA–QC and data calibration; RR was in charge of the installation and instrumentation maintenance at IZA. EC and RR were responsible for Izaña BSRN. VEC, AR and JMR contributed to the revision of the paper.
The authors declare that they have no conflict of interest.
This work is part of the activities of the World Meteorological Organization
(WMO) Commission for Instruments and Methods of Observations (CIMO) Izaña
test bed for aerosols and water vapor remote sensing instruments. The authors
thank the BSRN for providing quality control tools and maintaining a
centralized quality-assured database. Authors are grateful to Robert P. Stone
(NOAA, National Oceanic and Atmospheric Administration) for his audit visit
to the Izaña Observatory and corresponding proposal to enroll in the BSRN, and
to Ells Dutton (who passed away in 2012) for presenting the candidacy of the
Izaña station at the 11th Biennial Baseline Surface Radiation Network
(BSRN) Scientific Review and Workshop (New Zealand). The careful daily
maintenance work made by IZA observers and SIELTEC Canarias technicians is
very much appreciated. Antonio Cruz, the Izaña Atmospheric Research Center
computer technician, helped in the development of BSRN. Most of the
instrument pictures in this work were provided by Conchy Bayo. The authors
appreciate the PMOD/WRC calibration facilities and collaboration. The IZA
BSRN program has benefited from results obtained within POLARMOON project
funded by the Ministerio de Economía y Competividad from Spain,
CTM2015-66742-R. We also acknowledge our colleague Dr. Celia Milford for
improving the English language of the
manuscript.
Edited by: Luis Vazquez
Reviewed by: four anonymous referees
Antonanzas-Torres, F., Antonanzas, J., Urraca, R., Alia-Martinez, A., and Martinez-de Pison, F.: Impact of atmospheric components on solar clear-sky models at different elevation: Case study Canary Islands, Energ. Convers. Manage., 109, 122–129, https://doi.org/10.1016/j.enconman.2015.11.067, 2016. a
Bass, A. and Paur, R.: The ultraviolet cross-sections of ozone: I. The measurements, in: Atmospheric ozone, Springer, 606–610, 1985. a
Bolsée, D. and Pereira, N., Cuevas, E., and García, R., and Redondas, A.: Comments to the Article by Thuillier et al. “The Infrared Solar Spectrum Measured by the SOLSPEC Spectrometer Onboard the International Space Station on the Interpretation of Ground-based Measurements at the Izaña Site, Sol. Phys., 291, 2473–2477, https://doi.org/10.1007/s11207-016-0914-1, 2016. a
Borges, M., Sierra, M., Cuevas, E., García, R., and Esparza, P.: Photocatalysis with solar energy: Sunlight-responsive photocatalyst based on TiO2 loaded on a natural material for wastewater treatment, Sol. Energy, 135, 527–535, https://doi.org/10.1016/j.solener.2016.06.022, 2016. a
Borges, M. E., Sierra, M., and Esparza, P.: Solar photocatalysis at semi-pilot scale: wastewater decontamination in a packed-bed photocatalytic reactor system with a visible-solar-light-driven photocatalyst, Clean Technol. Envir., 19, 1239–1245, https://doi.org/10.1007/s10098-016-1312-y, 2017. a
Carrillo, J., Guerra, J., Cuevas, E., and Barrancos, J.: Characterization of the Marine Boundary Layer and the Trade-Wind Inversion over the Sub-tropical North Atlantic, Bound.-Lay. Meteor., 158, 311–330, https://doi.org/10.1007/s10546-015-0081-1, 2016. a
Cuevas, E., González, Y., Rodríguez, S., Guerra, J. C., Gómez-Peláez, A. J., Alonso-Pérez, S., Bustos, J., and Milford, C.: Assessment of atmospheric processes driving ozone variations in the subtropical North Atlantic free troposphere, Atmos. Chem. Phys., 13, 1973–1998, https://doi.org/10.5194/acp-13-1973-2013, 2013. a
Cuevas, E., Camino, C., Benedetti, A., Basart, S., Terradellas, E., Baldasano, J. M., Morcrette, J. J., Marticorena, B., Goloub, P., Mortier, A., Berjón, A., Hernández, Y., Gil-Ojeda, M., and Schulz, M.: The MACC-II 2007–2008 reanalysis: atmospheric dust evaluation and characterization over northern Africa and the Middle East, Atmos. Chem. Phys., 15, 3991–4024, https://doi.org/10.5194/acp-15-3991-2015, 2015. a
Cuevas, E., Milford, C., Bustos, J.J., del Campo-Hernández, R., García, O. E., García, R. D.,Gómez-Peláez, A. J., Guirado-Fuentes, C., Marrero, C., Prats, N., Ramos, R., Redondas, A., Reyes, E., Rodríguez, S., Romero-Campos, P. M., Schneider, M., Belmonte, J., Yela, M., Almansa, F., Barreto, A., López-Solano, C., Basart, S., Terradellas, E., Afonso, S., Bayo, C., Berjón, A., Bethencourt, J., Carre no, V., Castro, N. J., Cruz, A. M., Damas, M., De Ory-Ajamil, F., García, M. I., Gómez-Trueba, V., González, Y., Hernández, C., Hernández, Y., Hernández-Cruz, B., Jover, M., León-Luís, S. F., López-Fernández, R., López-Solano, J., Rodríguez, E., Rodríguez-Franco, J. J., Rodríguez-Valido, M., Sálamo, C., Sanromá, E., Santana, D., Santo Tomás, F., Sepúlveda, E., Sierra, M., and Sosa, E.: Izaña Atmospheric Research Center Activity Report 2015–2016, State Meteorological Agency (AEMET), Madrid, Spain and World Meteorological Organization, Geneva, Switzerland, NIPO 014-17-012-9, WMO/GAW Report No. 236, 2017. a, b, c
Cuevas-Agulló, E.: Basic and other measurements of radiation at station Izana (2017-10), https://doi.org/10.1594/PANGAEA.882526, 2017. a
Driemel, A., Augustine, J., Behrens, K., Colle, S., Cox, C., Cuevas-Agulló, E., Denn, F. M., Duprat, T., Fukuda, M., Grobe, H., Haeffelin, M., Hodges, G., Hyett, N., Ijima, O., Kallis, A., Knap, W., Kustov, V., Long, C. N., Longenecker, D., Lupi, A., Maturilli, M., Mimouni, M., Ntsangwane, L., Ogihara, H., Olano, X., Olefs, M., Omori, M., Passamani, L., Pereira, E. B., Schmithüsen, H., Schumacher, S., Sieger, R., Tamlyn, J., Vogt, R., Vuilleumier, L., Xia, X., Ohmura, A., and König-Langlo, G.: Baseline Surface Radiation Network (BSRN): structure and data description (1992–2017), Earth Syst. Sci. Data, 10, 1491–1501, https://doi.org/10.5194/essd-10-1491-2018, 2018. a
Ellis, H. T. and Pueschel, R. F.: Solar Radiation: Absence of Air Pollution Trends at Mauna Loa, American Association for the Advancement of Science, 172, 845–846, https://doi.org/10.1126/science.172.3985.845, 1971. a
Emde, C., Buras-Schnell, R., Kylling, A., Mayer, B., Gasteiger, J., Hamann, U., Kylling, J., Richter, B., Pause, C., Dowling, T., and Bugliaro, L.: The libRadtran software package for radiative transfer calculations (version 2.0.1), Geosci. Model Dev., 9, 1647–1672, https://doi.org/10.5194/gmd-9-1647-2016, 2016. a
García, M. I., Rodríguez, S., González, Y., and García, R. D.: Climatology of new particle formation at Iza na mountain GAW observatory in the subtropical North Atlantic, Atmos. Chem. Phys., 14, 3865–3881, https://doi.org/10.5194/acp-14-3865-2014, 2014a. a
García, R. D., Cuevas, E., García, O. E., Cachorro, V. E., Pallé, P., Bustos, J. J., Romero-Campos, P. M., and de Frutos, A. M.: Reconstruction of global solar radiation time series from 1933 to 2013 at the Izaña Atmospheric Observatory, Atmos. Meas. Tech., 7, 3139–3150, https://doi.org/10.5194/amt-7-3139-2014, 2014b. a
García, R. D., García, O. E., Cuevas, E., Cachorro, V. E., Romero-Campos, P. M., Ramos, R., and de Frutos, A. M.: Solar radiation measurements compared to simulations at the BSRN Izaña station. Mineral dust radiative forcing and efficiency study, J. Geophys. Res.-Atmos., 119, 179–194, https://doi.org/10.1002/2013JD020301, 2014. a, b, c, d, e, f
García, R. D., Cachorro, V. E., Cuevas, E., Toledano, C., Redondas, A., Blumthaler, M., and Benounna, Y.: Comparison of measured and modelled spectral UV irradiance at Izaña high mountain station: estimation of the underlying effective albedo, Int. J. Climatol., 36, 377–388, https://doi.org/10.1002/joc.4355, 2015. a
García, R. D., García, O. E., Cuevas, E., Cachorro, V. E., Barreto, A., Guirado-Fuentes, C., Kouremeti, N., Bustos, J. J., Romero-Campos, P. M., and de Frutos, A. M.: Aerosol optical depth retrievals at the Izaña Atmospheric Observatory from 1941 to 2013 by using artificial neural networks, Atmos. Meas. Tech., 9, 53–62, https://doi.org/10.5194/amt-9-53-2016, 2016. a
García, R. D., Cuevas, E., García, O. E., Ramos, R., Romero-Campos, P. M., de Ory, F., Eugenia Cachorro, V., and de Frutos, A.: Compatibility of different measurement techniques of global solar radiation and application for long-term observations at Izaña Observatory, Atmos. Meas. Tech., 10, 731–743, https://doi.org/10.5194/amt-10-731-2017, 2017. a, b
García, R. D., Barreto, A., Cuevas, E., Gröbner, J., García, O. E., Gómez-Peláez, A., Romero-Campos, P. M., Redondas, A., Cachorro, V. E., and Ramos, R.: Comparison of observed and modeled cloud-free longwave downward radiation (2010–2016) at the high mountain BSRN Izaña station, Geosci. Model Dev., 11, 2139–2152, https://doi.org/10.5194/gmd-11-2139-2018, 2018. a, b, c
García Cabrera, R. D.: Aplicación de modelos de transferencia radiativa para el control operativo del programa BSRN (Baseline Surface Radiation Network) del Centro de Investigación Atmosférica de Izaña, PhD thesis, Facultad de Ciencias, Universidad de Valladolid, 2011. a
Georgiev, A., Roth, P., and Olivares, A.: Sun following system adjustment at the UTFSM, Energ. Convers. Manage., 45, 1795–1806, https://doi.org/10.1016/j.enconman.2003.09.024, 2004. a
Gilgen, H., Whitlock, C., Koch, F., Müller, G., Ohmura, A., Steiger, D., and Wheeler, R.: Technical Plan for BSRN (Baseline Surface Radiation Network) Data Management, WMO/TD-No. 443, WCRP/WMO, 1995. a
González, Y., López, C., and Cuevas, E.: Cloud nowcasting: Motion analysis of all sky images using velocity fields, Instrum. Viewp., 14, p. 61, 2013. a
Hofmann, M. and Seckmeyer, G.: A New Model for Estimating the Diffuse Fraction of Solar Irradiance for Photovoltaic System Simulations, Energies, 10, 248, https://doi.org/10.3390/en10020248, 2017. a
Holben, B., Eck, T., Slutsker, I., Tanré, D., Buis, J., Setzer, A., Vermote, E., Reagan, J., Kaufman, Y., Nakajima, T., Lavenu, F., Jankowiak, I., and Smirnov, A.: AERONET A Federated Instrument Network and Data Archive for Aerosol Characterization, Remote Sens. Environ., 66, 1–16, https://doi.org/10.1016/S0034-4257(98)00031-5, 1998. a, b, c, d
INTRA: Software Interface Definition Document, INTRA/SIDD/1827-BRU Version 1.03 of 18-Jun-2010, CH-8712 Stäfa (Switzerland), available at:http://www.owel-swiss.ch/Files/Files_Brusag/SIDD_1827_103.pdf (last access: 7 February 2019), 2010. a
König-Langlo, G., Sieger, R., Schmithüsen, H., Bücker, A., Richter, F., and Dutton, E.: The Baseline Surface Radiation Network and its World Radiation Monitoring Centre at the Alfred Wegener Institute, WCRP Report, GCOS-1, 2013. a
Kosmopoulos, P. G., Kazadzis, S., Taylor, M., Raptis, P. I., Keramitsoglou, I., Kiranoudis, C., and Bais, A. F.: Assessment of surface solar irradiance derived from real-time modelling techniques and verification with ground-based measurements, Atmos. Meas. Tech., 11, 907–924, https://doi.org/10.5194/amt-11-907-2018, 2018. a
Kurucz, R. L.: Synthetic infrared spectra, in: Infrared solar physics, IAU Symp. 154, edited by: Rabin, D. M. and Jefferies, J. T., Kluwer, Acad., Norwell, MA, Springer, 1992. a
Lenz, J. M., Sartori, H. C., and Pinheiro, J. R.: Mission profile characterization of PV systems for the specification of power converter design requirements, Sol. Energy, 157, 263–276, https://doi.org/10.1016/j.solener.2017.08.020, 2017. a
León-Luis, S. F., Redondas, A., Carreño, V., López-Solano, J., Berjón, A., Hernández-Cruz, B., and Santana-Díaz, D.: Internal consistency of the Regional Brewer Calibration Centre for Europe triad during the period 2005–2016, Atmos. Meas. Tech., 11, 4059–4072, https://doi.org/10.5194/amt-11-4059-2018, 2018. a
Liepert, B.: Observed reductions of surface solar radiation at sites in the United States and worldwide from 1961 to 1990, Geophys. Res. Lett., 29, 61–1–61–4, https://doi.org/10.1029/2002GL014910, 2002. a
Linares-Rodriguez, A., Quesada-Ruiz, S., Pozo-Vazquez, D., and Tovar-Pescador, J.: An evolutionary artificial neural network ensemble model for estimating hourly direct normal irradiances from meteosat imagery, Energy, 91, 264–273, https://doi.org/10.1016/j.energy.2015.08.043, 2015. a
Long, C. and Shi, Y.: The QCRad value added product: Surface radiation measurement quality control testing, including climatology configurable limits, Tech. rep., DOE Office of Science Atmospheric Radiation Measurement (ARM) Program (United States), https://doi.org/10.2172/1019540, 2006. a, b
Long, C. N. and Ackerman, T. P.: Identification of clear skies from broadband pyranometer measurements and calculation of downwelling shortwave cloud effects, J. Geophys. Res.-Atmos., 105, 15609–15626, https://doi.org/10.1029/2000JD900077, 2000. a
Long, C. N. and Dutton, E. G.: BSRN Global Network recommended QC tests, V2. x, https://doi.org/10013/epic.38770.d001, 2002. a, b, c
Long, C. N. and Shi, Y.: An automated quality assessment and control algorithm for surface radiation measurements, The Open Atmospheric Science Journal, 2, 23–37, https://doi.org/10.2174/1874282300802010023, 2008. a
Mayer, B. and Kylling, A.: Technical note: The libRadtran software package for radiative transfer calculations – description and examples of use, Atmos. Chem. Phys., 5, 1855–1877, https://doi.org/10.5194/acp-5-1855-2005, 2005. a
McArthur, L.: Baseline Surface Radiation Network (BSRN) Operations Manual V2.1, World Climate Research Programme,wmo/td-no. 1274 ed., WCRP-121, 2005. a, b, c, d, e
Myhre, G., Shindell, D., Bréon, F.-M., Collins, W., Fuglestvedt, J., Huang, J., Koch, D., Lamarque, J.-F., Lee, D., Mendoza, B., Nakajima, T., Robock, A., Stephens, G., Takemura, T., and Zhang, H.: Anthropogenic and Natural Radiative Forcing, in: Climate change 2013: the physical science basis. Contribution of Working Group I to the Fifth Assessment Report of the Intergovernmental Panel on Climate Change, K., edited by: Tignor, M., Allen, S. K., Boschung, J., Nauels, A., Xia, Y., Bex, V., and Midgley, P. M., Cambridge University Press Cambridge, United Kingdom and New York, NY, USA, 2013 a
Ohmura, A.: Observed decadal variations in surface solar radiation and their causes, J. Geophys. Res.-Atmos., 114, https://doi.org/10.1029/2008JD011290, 2009. a, b
Ohmura, A., Gilgen, H., Hegner, H., Müller, G., Wild, M., Ellsworth G., Forgan, B., Fröhlich, C., Philipona,R., Heimo, A., König-Langlo, G., McArthur, B., Pinker, R. ,Whitlock, C. H., and Dehne, K.: Baseline Surface Radiation Network (BSRN/WCRP): New precision radiometry for climate research, B. Am. Meteorol. Soc., 79, 2115–2136, https://doi.org/10.1175/1520-0477(1998)079<2115:BSRNBW>2.0.CO;2, 1998. a
Pierluissi, J. H. and Peng, G.-S.: New molecular transmission band models for LOWTRAN, Opt. Eng., 24, 243541, https://doi.org/10.1117/12.7973523, 1985. a
Quesada-Ruiz, A., Linares-Rodríguez, A., Ruiz-Arias, J., Pozo-Vázquez, D., and Tovar-Pescador, J.: An advanced ANN-based method to estimate hourly solar radiation from multi-spectral MSG imagery, Sol. Energy, 115, 494–504, https://doi.org/10.1016/j.solener.2015.03.014, 2015. a
Redondas, A. and Cede, A.: Brewer algorithm sensitivity analysis, in: Sauna Workshop, Puerto de la Cruz, Tenerife, Spain, 2006. a
Ricchiazzi, P., Yang, S., Gautier, C., and Sowle, D.: SBDART: A research and teaching software tool for plane-parallel radiative transfer in the Earth's atmosphere, B. Am. Meteorol. Soc., 79, 2101–2114, 1998. a
Rodríguez, S., Cuevas, E., Prospero, J. M., Alastuey, A., Querol, X., López-Solano, J., García, M. I., and Alonso-Pérez, S.: Modulation of Saharan dust export by the North African dipole, Atmos. Chem. Phys., 15, 7471–7486, https://doi.org/10.5194/acp-15-7471-2015, 2015. a
Rodriguez-Franco, J. and Cuevas, E.: Characteristics of the subtropical tropopause region based on long-term highly resolved sonde records over Tenerife, J. Geophys. Res.-Atmos., 118, 10754–10769, https://doi.org/10.1002/jgrd.50839, 2013. a
Schmithüsen, H., Sieger, R., and König-Langlo, G.: BSRN Toolbox V2. 0 – a tool to create quality checked output files from BSRN datasets and station-to-archive files, https://doi.org/10.1594/PANGAEA.774827, 2012. a, b
Schroedter-Homscheidt, M., Benedetti, A., and Killius, N.: Verification of ECMWF and ECMWF/MACC's global and direct irradiance forecasts with respect to solar electricity production forecasts, Meteorol. Z., 26, 1–19, https://doi.org/10.1127/metz/2016/0676, 2017. a
Schroedter-Homscheidt, M., Kosmale, M., Jung, S., and Kleissl, J.: Classifying ground-measured 1 minute temporal variability within hourly intervals for direct normal irradiances, Meteorol. Z., https://doi.org/10.1127/metz/2018/0875, online first, 2018. a
Shettle, E. P.: Models of aerosols, clouds, and precipitation for atmospheric propagation studies, in: In AGARD, Atmospheric Propagation in the UV, Visible, IR, and MM-Wave Region and Related Systems Aspects 14 p (SEE N90-21907 15-32), 1990. a
Sieger, R. and Grobe, H.: PanPlot 2-software to visualize profiles and time series, https://doi.org/10.1594/PANGAEA.816201, 2013. a
Smith, C. J., Forster, P. M., and Crook, R.: An all-sky radiative transfer method to predict optimal tilt and azimuth angle of a solar collector, Sol. Energy, 123, 88–101, https://doi.org/10.1016/j.solener.2015.11.013, 2016. a
Stamnes, K., Tsay, S.-C., Wiscombe, W., and Jayaweera, K.: Numerically stable algorithm for discrete-ordinate-method radiative transfer in multiple scattering and emitting layered media, Appl. Optics, 27, 2502–2509, 1988. a
Stamnes, K., Tsay, S.-C., Wiscombe, W., and Laszlo, I.: DISORT, a general-purpose Fortran program for discrete-ordinate-method radiative transfer in scattering and emitting layered media: documentation of methodology, Tech. rep., Tech. rep., Dept. of Physics and Engineering Physics, Stevens Institute of Technology, Hoboken, NJ 07030, 2000. a
Stanhill, G. and Cohen, S.: Global dimming: a review of the evidence for a widespread and significant reduction in global radiation with discussion of its probable causes and possible agricultural consequences, Agr. Forest Meteorol., 107, 255–278, https://doi.org/10.1016/S0168-1923(00)00241-0, 2001. a
Stathopoulos, V. K. and Matsoukas, C.: Long-term memory and multifractality of downwelling longwave radiation flux at the Earth's surface, Clim. Dynam., 1–16, https://doi.org/10.1007/s00382-018-4473-z, 2018. a
Urraca, R., Huld, T., Gracia-Amillo, A., de Pison, F. J. M., Kaspar, F., and Sanz-Garcia, A.: Evaluation of global horizontal irradiance estimates from ERA5 and COSMO-REA6 reanalyses using ground and satellite-based data, Sol. Energy, 164, 339–354, https://doi.org/10.1016/j.solener.2018.02.059, 2018. a
Wild, M.: Global dimming and brightening: A review, J. Geophys. Res.-Atmos., 114, D00D16, https://doi.org/10.1029/2008JD011470, 2009. a
Wild, M., Gilgen, H., Roesch, A., Ohmura, A., Long, C. N., Dutton, E. G., Forgan, B., Kallis, A., Russak, V., and Tsvetkov, A.: From Dimming to Brightening: Decadal Changes in Solar Radiation at Earth's Surface, Science, 308, 847–850, https://doi.org/10.1126/science.1103215, 2005. a
WMO: Commission for Instruments and Methods of Observation,Sixteenth session WMO no.1138, Saint Petersburg, Secretariat of the World Meteorological Organization, 2014. a, b, c, d, e, f, g
WRCP: Report of the 12th Baseline Surface Radiation Network (BSRN) Scientific Review and Workshop, Alfred Wegener Institute, Potsdam, Germany, available at: http://bsrn.awi.de/fileadmin/user_upload/bsrn.awi.de/Publications/BSRN-12-2012.pdf (last access: 7 February 2019), 2012. a
WRCP: Report of the 13th Baseline Surface Radiation Network (BSRN) Scientific Review and Workshop, Institute of Atmospheric Sciences and Climate Bologna, Italy, available at: https://www.wcrp-climate.org/documents/BSRN-13_report.pdf (last access: 7 February 2019), 2014. a
Yu, S., Xin, X., Liu, Q., Zhang, H., and Li, L.: Comparison of Cloudy-Sky Downward Longwave Radiation Algorithms Using Synthetic Data, Ground-Based Data, and Satellite Data, J. Geophys. Res.-Atmos., 123, 5397–5415, https://doi.org/10.1029/2017JD028234, 2018. a